Track Your Metrics
Monitor real-time resource usage and service health across preview, staging, and production environments to ensure system stability and performance.
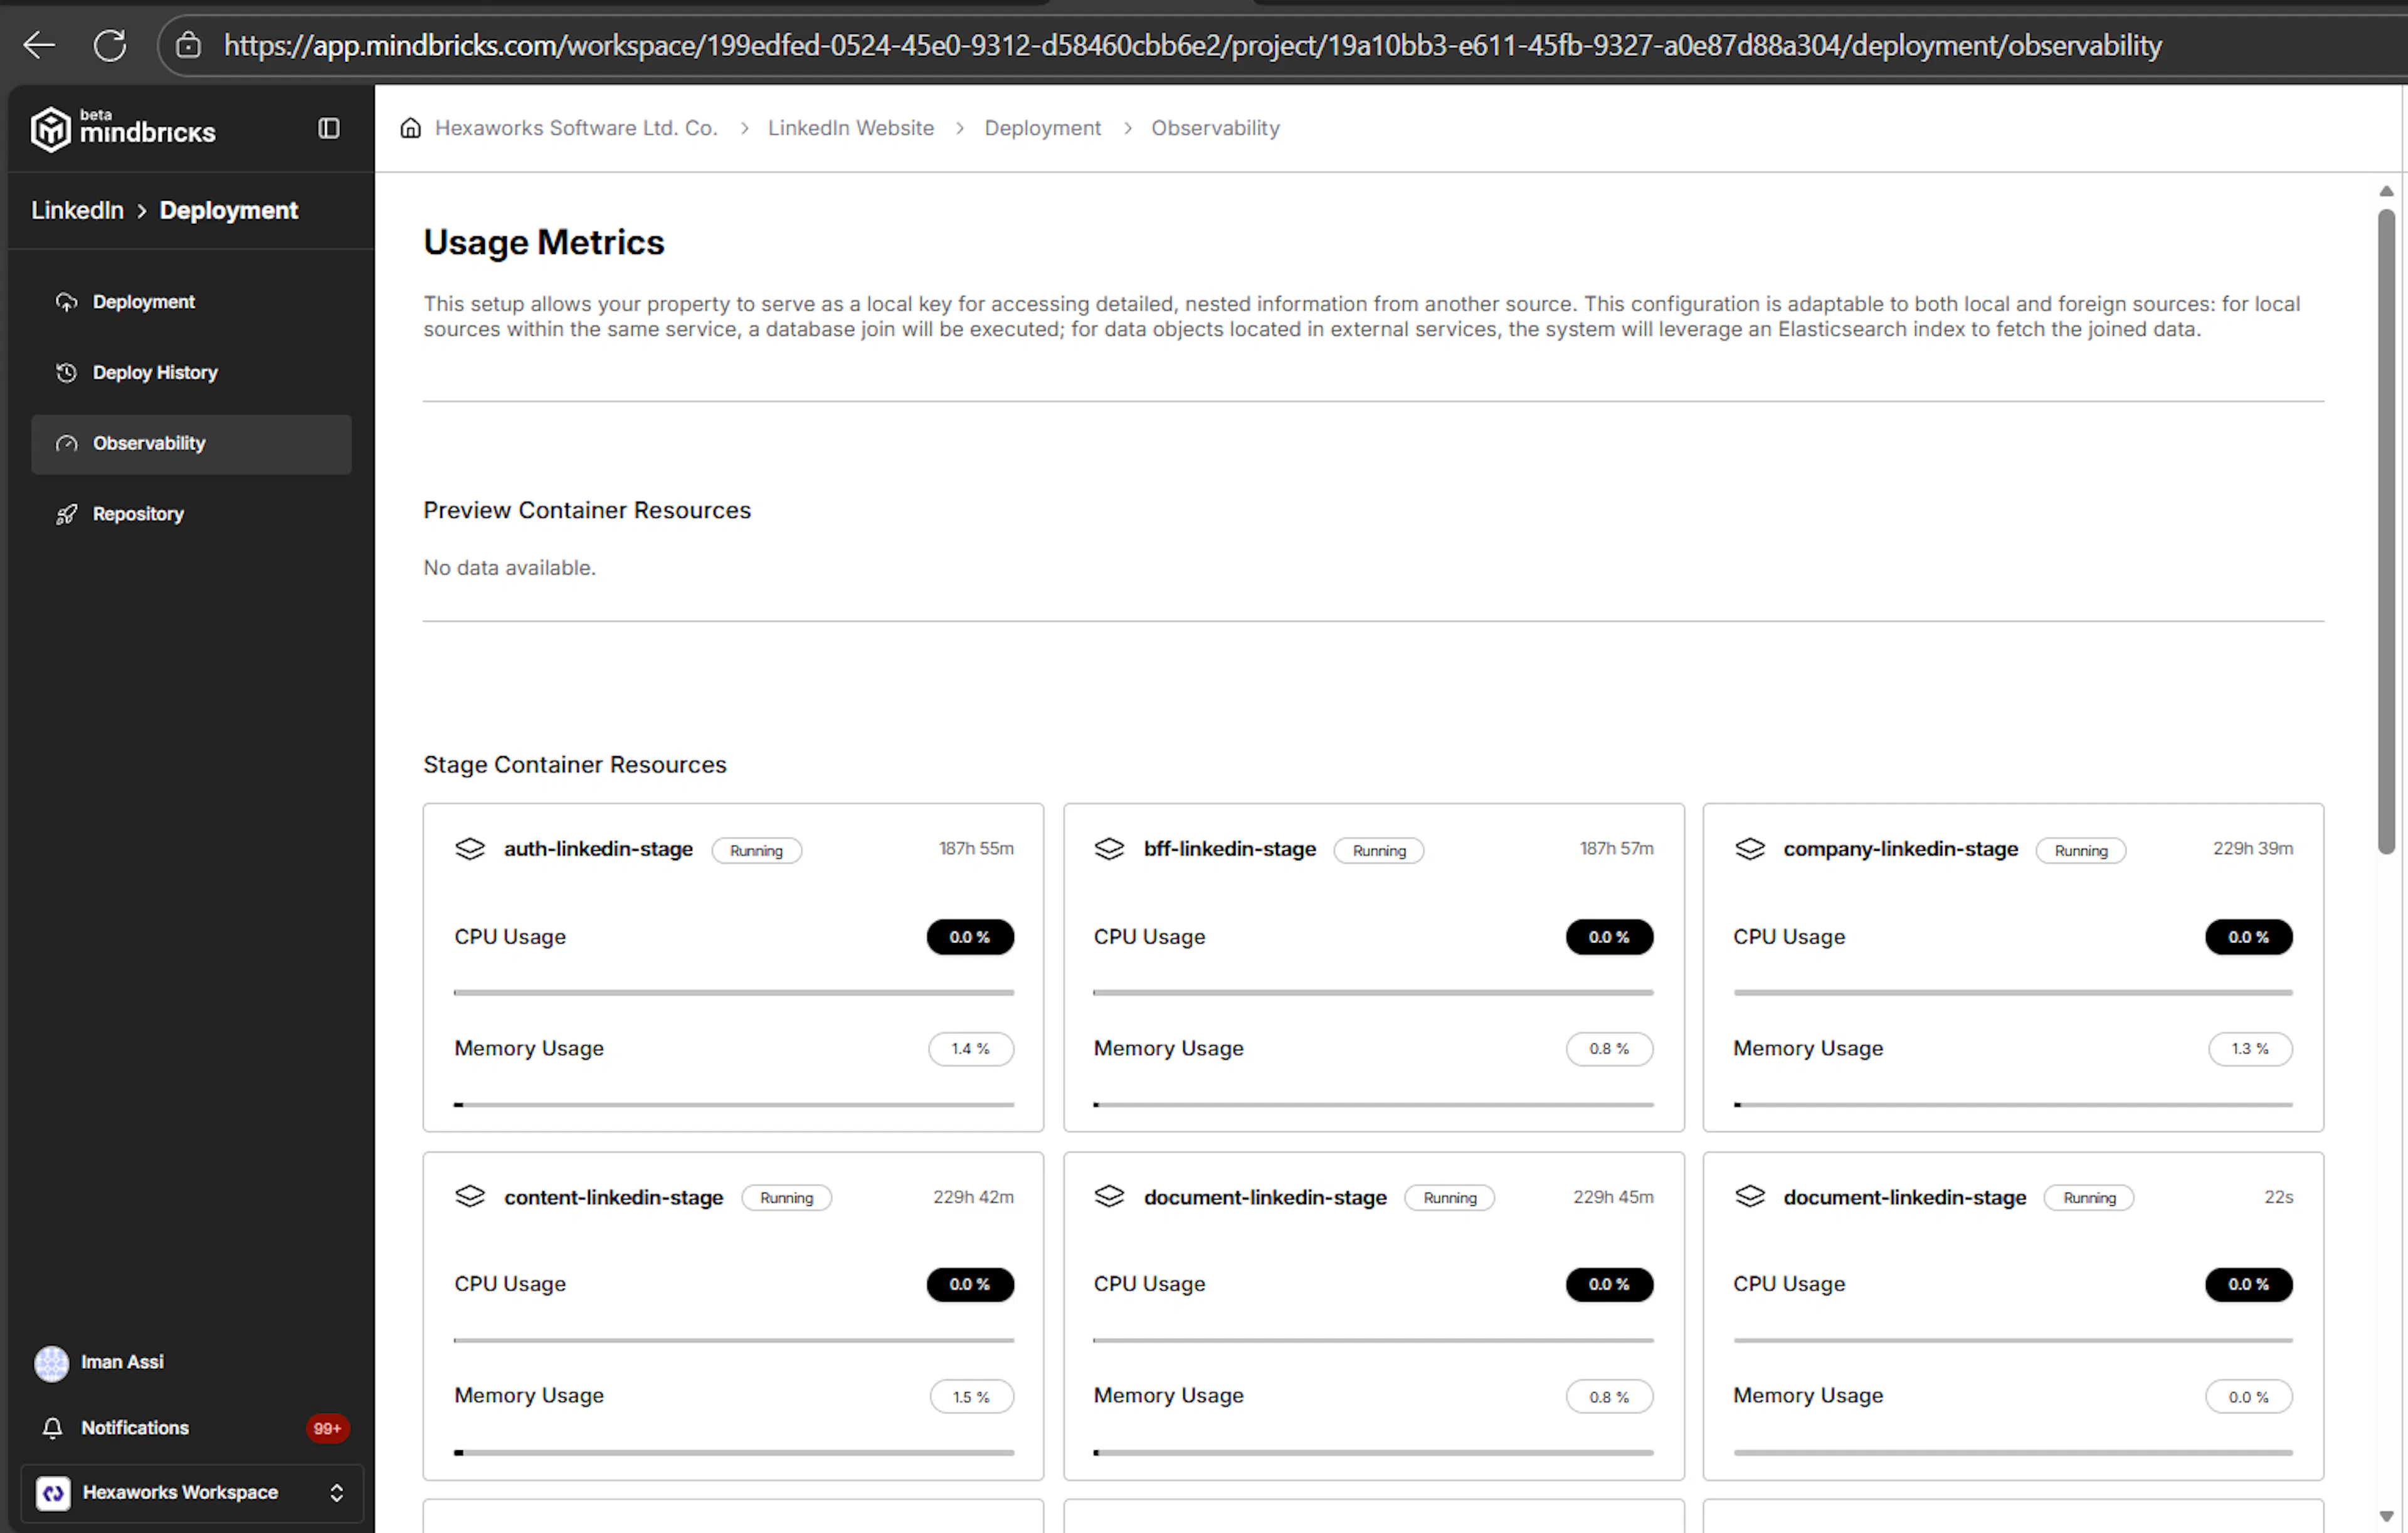
Observability & Metrics
The Observability page provides runtime visibility into all running services, including:
-
Preview environments – temporary 30-minute preview sessions created during API testing
-
Stage environments – deployed services used for validation and integration
-
Production environments – live services serving real users
Preview metrics appear only while a preview session is active, whereas stage and production metrics remain available as long as the server is active and the services are running.
What Observability Shows
The Observability page displays container-level metrics for each environment:
-
Preview environment
-
Stage environment
-
Production environment
Each deployed service runs inside its own container, and metrics are shown per service, not aggregated.
Container Resource Metrics
For every running service container, you can see:
CPU Usage
-
Shows the current CPU consumption percentage
-
Helps identify:
-
CPU-heavy services
-
Inefficient logic
-
Unexpected processing spikes
-
Memory Usage
-
Displays memory consumption as a percentage
-
Useful for detecting:
-
Memory leaks
-
Under-provisioned services
-
Sudden memory growth after deployments
-
Runtime Status
Each container clearly shows its current state:
-
Running
-
Pending
-
Failed
You can immediately tell which services are healthy and which may need attention.
Uptime info
Each service container displays uptime information.
Uptime shows:
-
How long the service has been running continuously
-
Whether the container was recently restarted
-
Stability of the service after deployment
Uptime helps you:
-
Verify successful deployments
-
Detect unexpected restarts or crashes
-
Understand service longevity in Stage and Production environments
For preview environments, uptime reflects the short-lived preview session. For stage and production, uptime persists as long as the service remains deployed and running.
Environment Separation
Metrics are grouped by environment so you can clearly distinguish:
-
Preview metrics – short-lived, used for testing
-
Stage metrics – long-running validation environment
-
Production metrics – real user traffic and live workloads
This separation helps you:
-
Validate performance in Stage before Production
-
Compare resource usage across environments
-
Debug issues without affecting live users
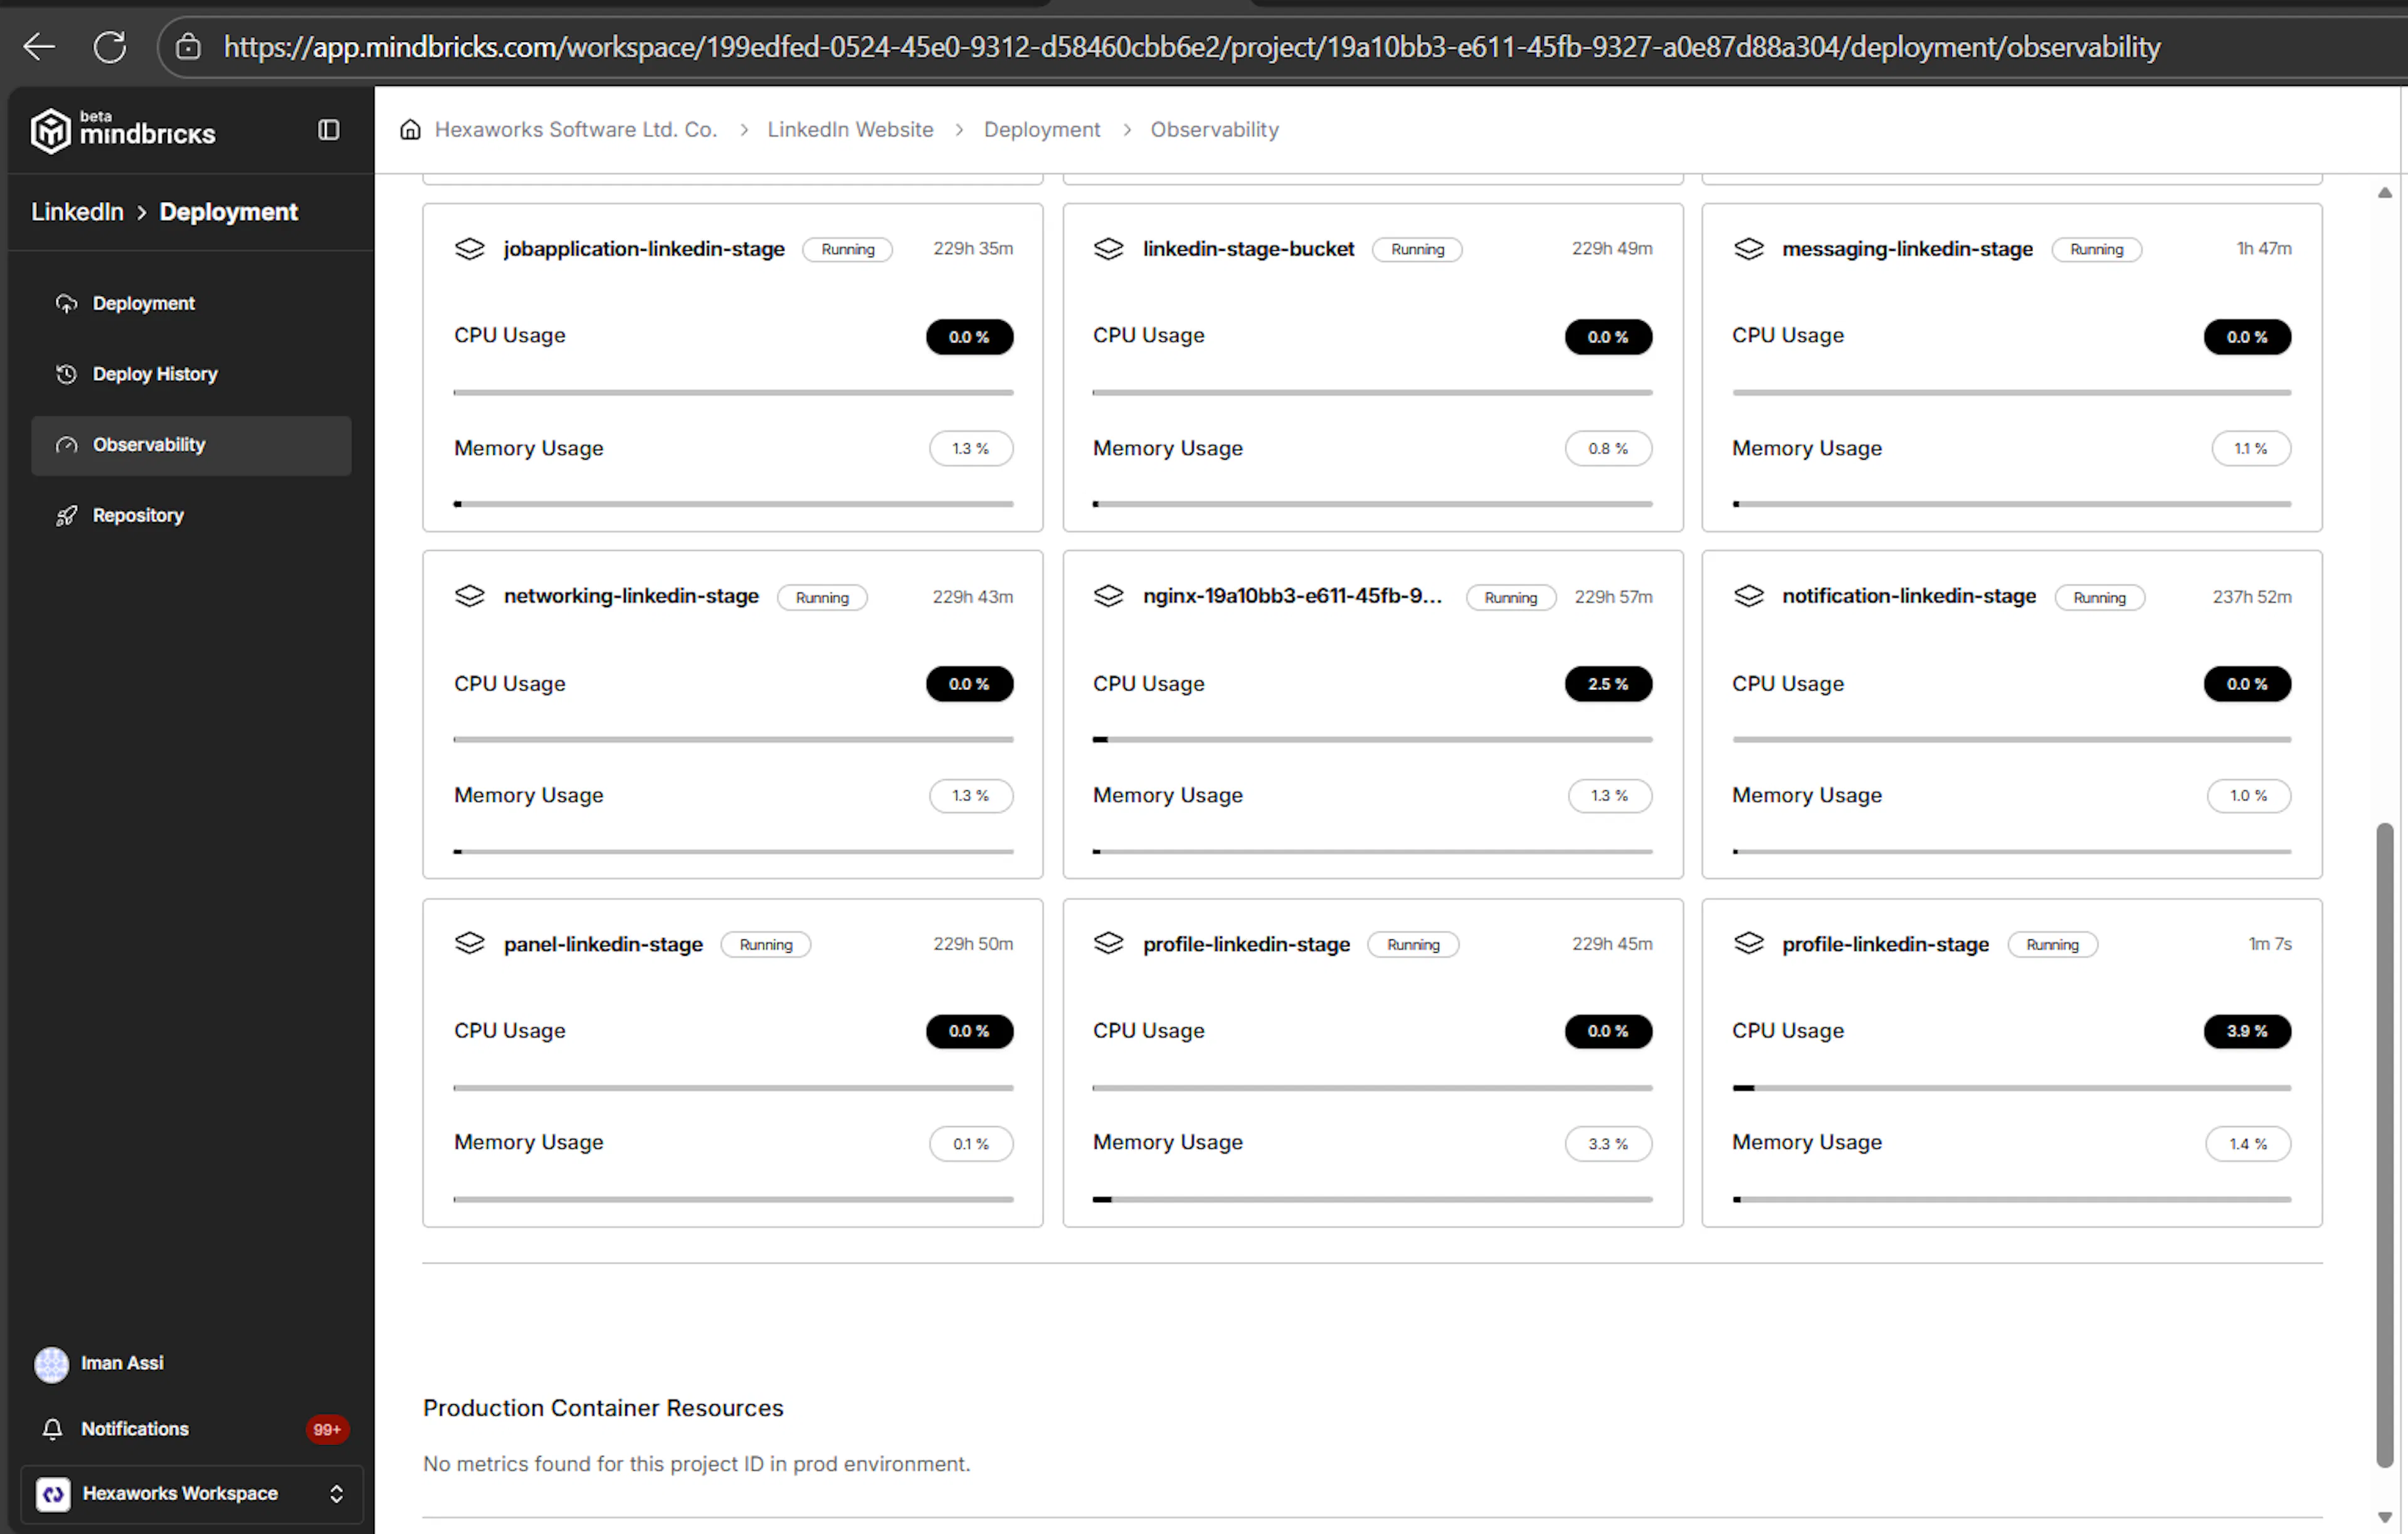
Service-Level Visibility
Each card represents a single microservice container, such as:
-
auth -
bff -
notification -
panel -
domain-specific services (e.g.
company,messaging,content)
This makes it easy to:
-
Identify which service is consuming the most resources
-
Correlate performance issues to a specific service
-
Scale or optimize only the affected parts of the system
When Metrics Are Not Available
If you see messages like:
No data available No metrics found for this project ID in preview/stage/prod environment.
This usually means:
-
The environment has not been deployed yet
-
No containers are currently running
-
The service was recently stopped or restarted
Once services are deployed and running, metrics appear automatically.
Why Observability Matters
The Observability page allows you to:
-
Monitor live system health
-
Catch performance issues early
-
Validate deployments after releases
-
Gain confidence before scaling traffic
-
Operate production systems safely
It acts as the first line of insight into how your application behaves in the real world.
ℹ️ Important Note
Observability is read-only and non-intrusive.
It does not modify deployments or affect runtime behavior — it only gives you visibility.
For deeper debugging, logs and API testing are available through Preview, Deploy History, and service-level tools.