Preview Your App
Test and explore your application and generated APIs in a temporary preview environment before deploying to staging or production.
Previewing Your Application
After all microservices are designed and marked as Ready, Mindbricks allows you to preview your application and its APIs before deploying to staging or production.
Previewing helps you validate:
-
Service health and connectivity
-
Generated APIs
-
Authentication flow
-
Data object endpoints
-
Business logic behavior
Each preview session is isolated, temporary, and safe for testing.
Starting a Preview Session
When you click Preview on a service:
-
A temporary preview environment is created
-
Mindbricks runs health checks on:
-
Service code
-
Dependencies
-
Database connections
-
Internal service wiring
-
-
The preview button turns green
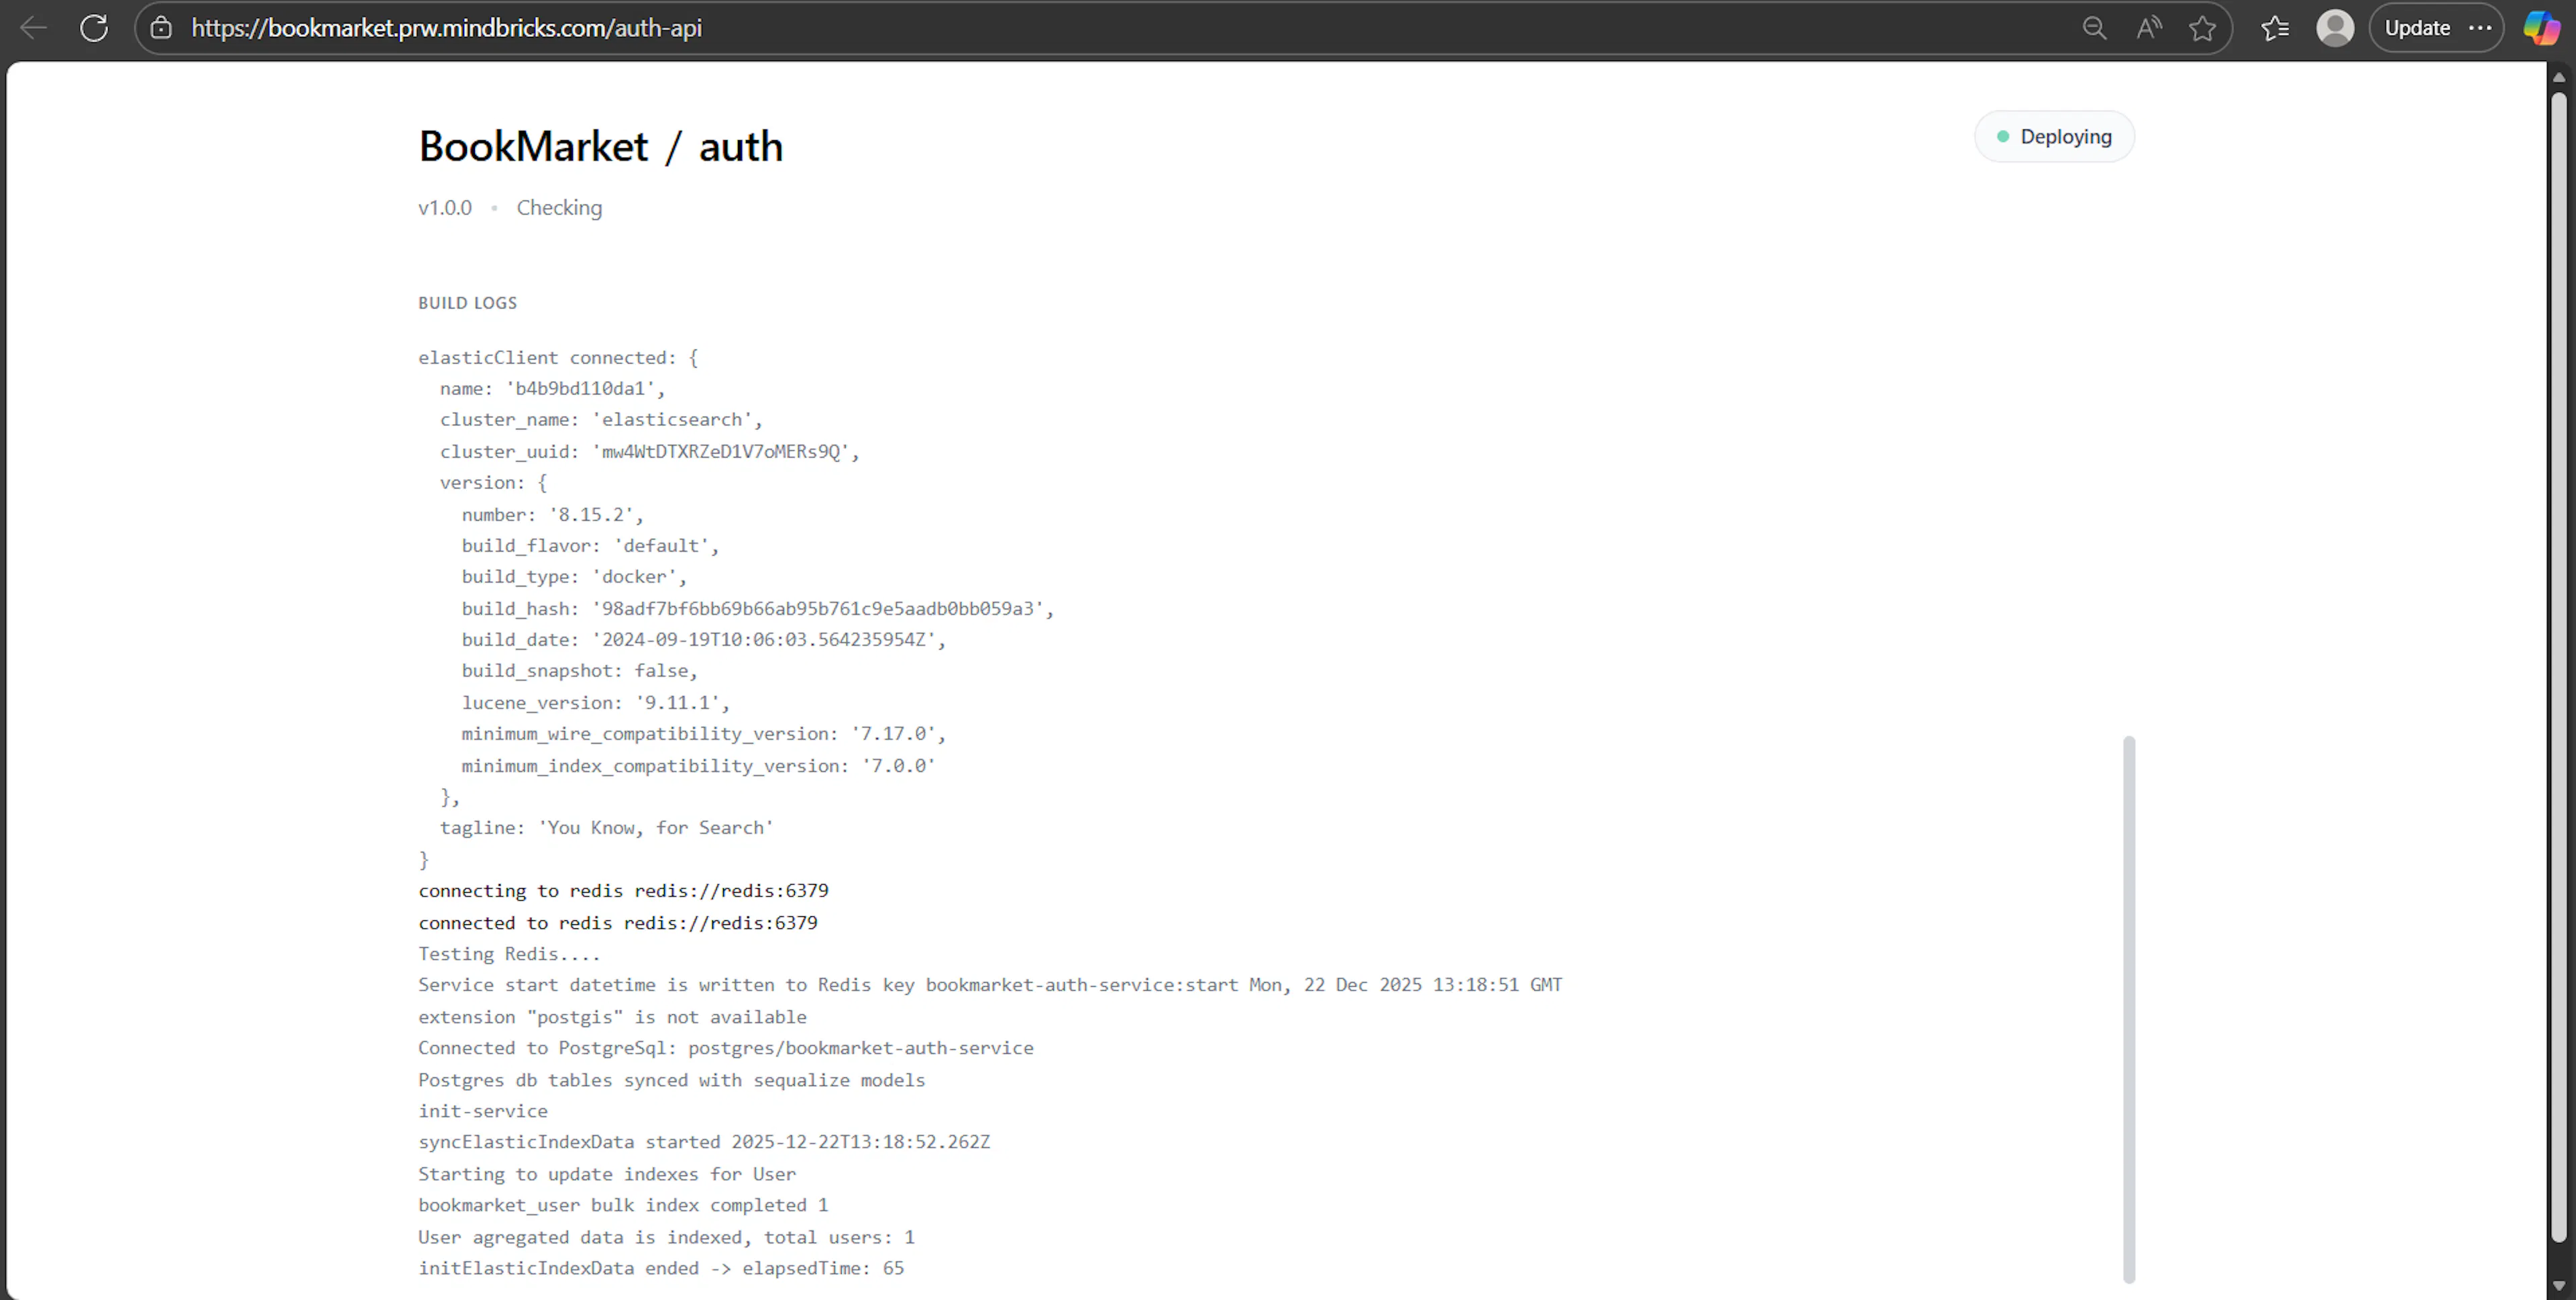
Before the API interface opens, you will briefly see a service logs screen where Mindbricks verifies that everything is ready.
Only after all checks pass does the API interface become available.
Preview Session Duration
-
Each preview session lasts 30 minutes
-
When the session expires, the preview environment shuts down automatically
-
You can start a new preview at any time by clicking Preview again
This ensures efficient resource usage and secure isolation.
API Interface (API Face)
Once the preview is ready, you are redirected to the API Interface of the selected service.
This interface allows you to:
-
Browse all generated endpoints
-
Send API requests
-
Inspect request parameters
-
View responses and execution details
Each service has its own API interface, scoped only to that service.
Special Preview Types
In addition to standard service API previews, some services provide specialized preview experiences depending on their role in the system.
Previewing the Document Service
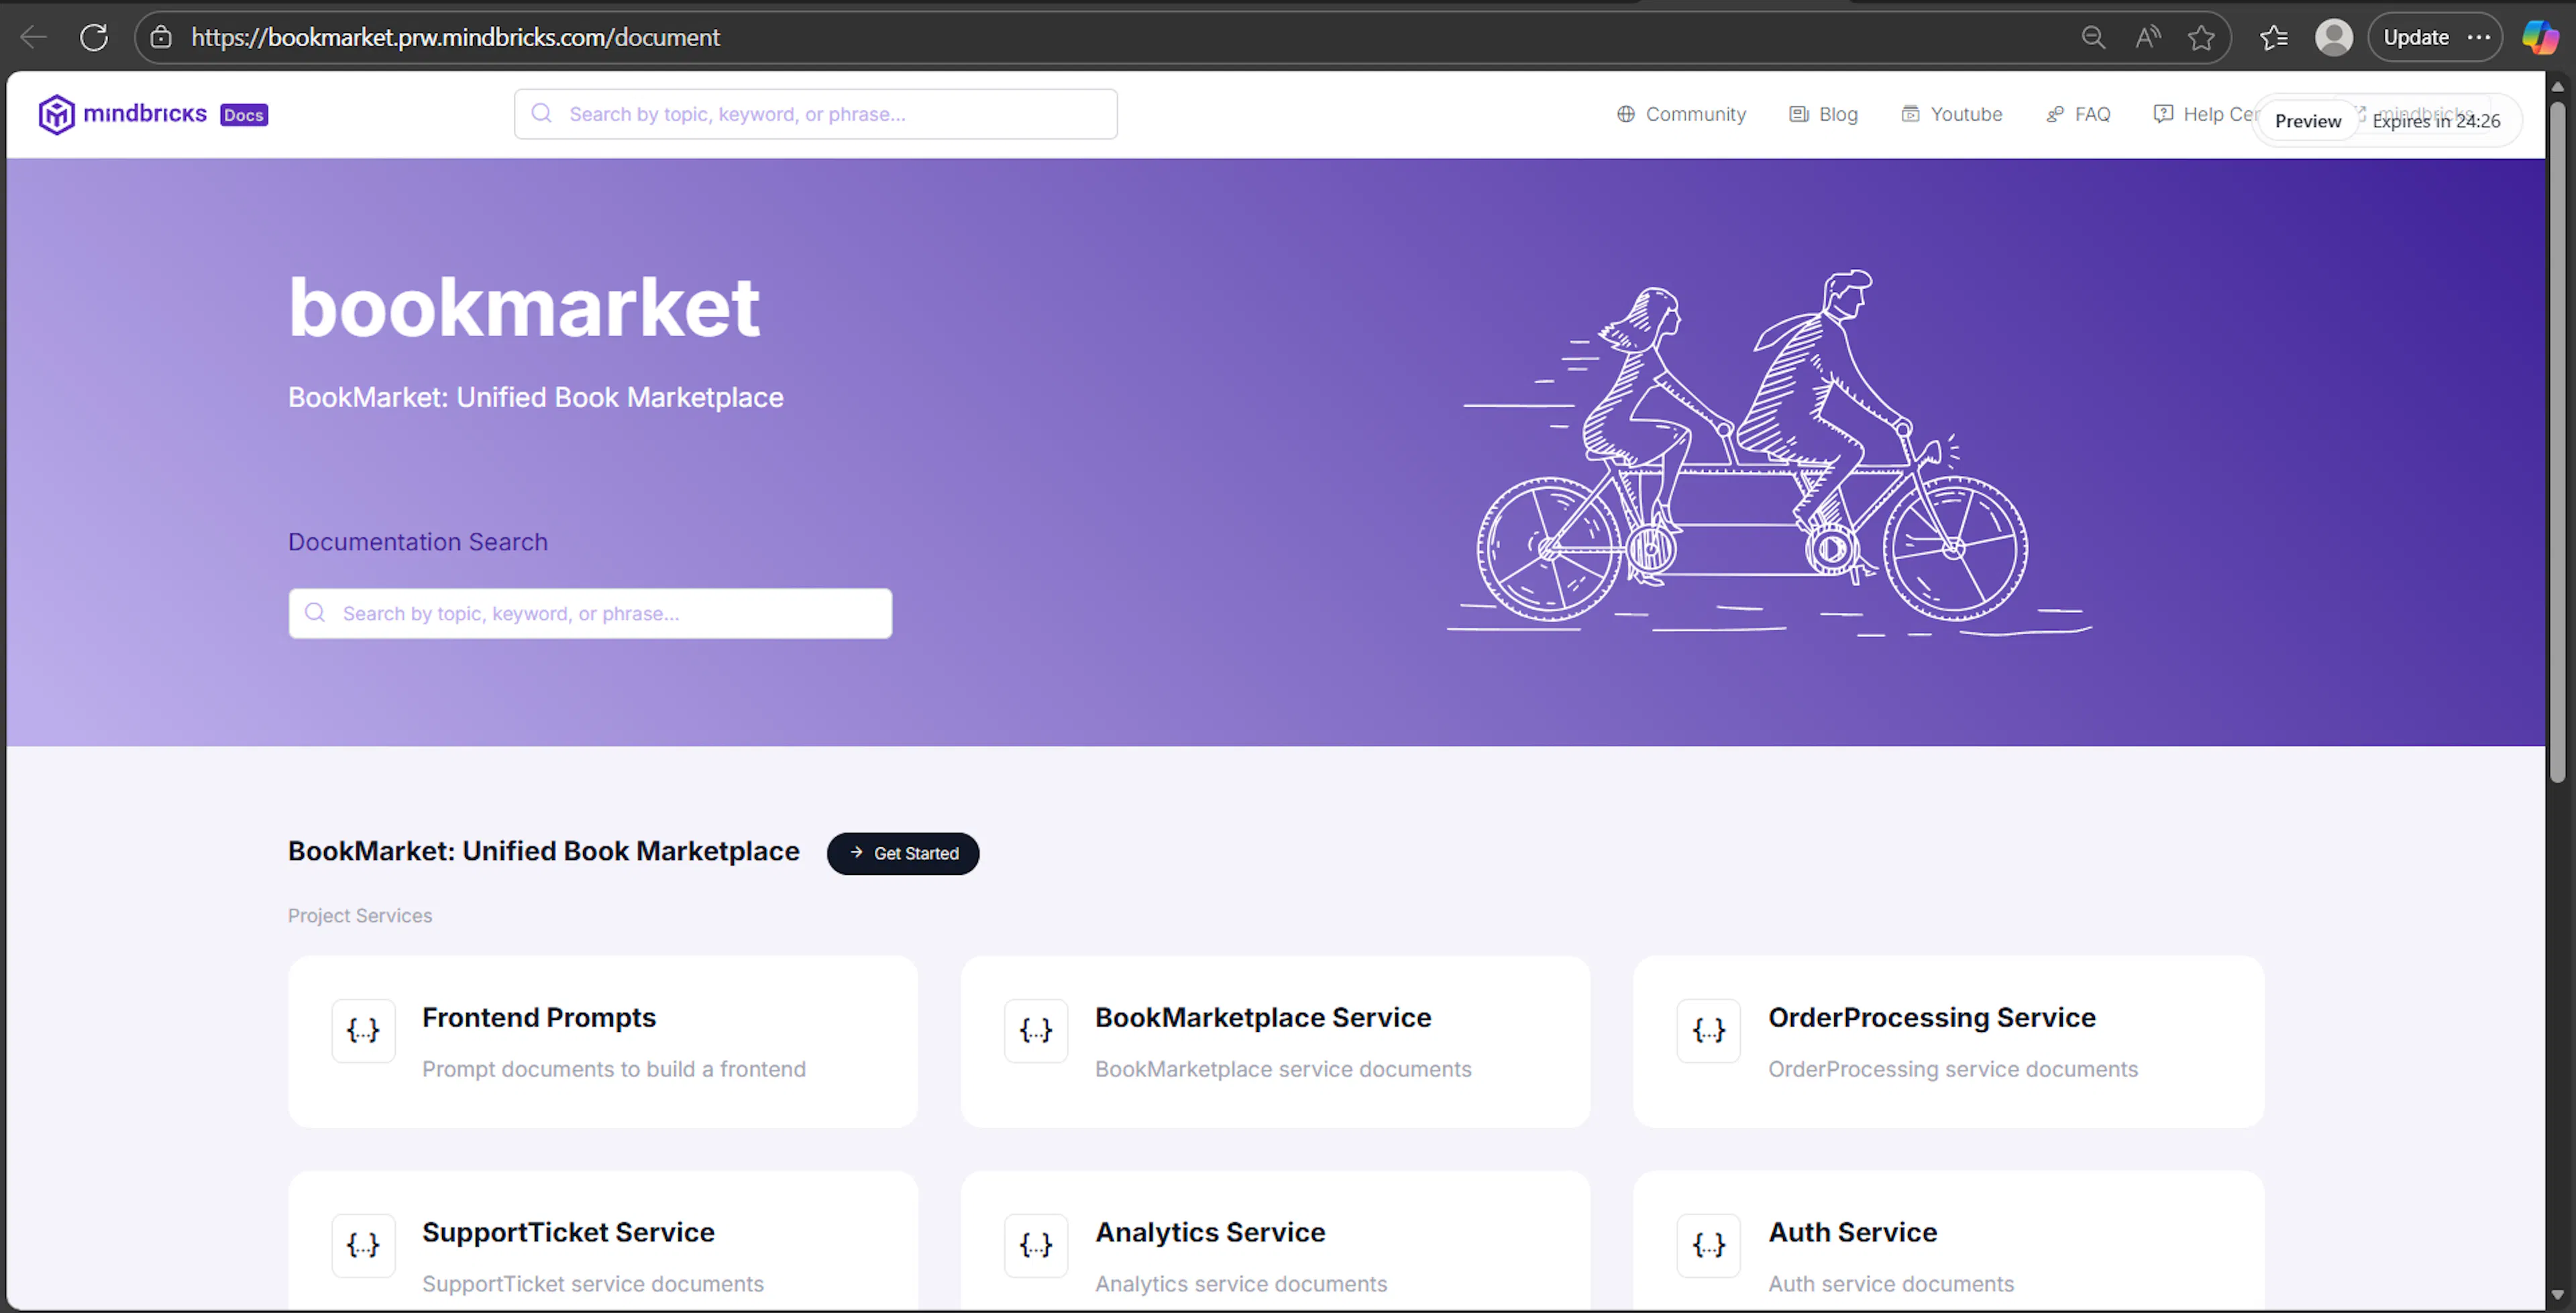
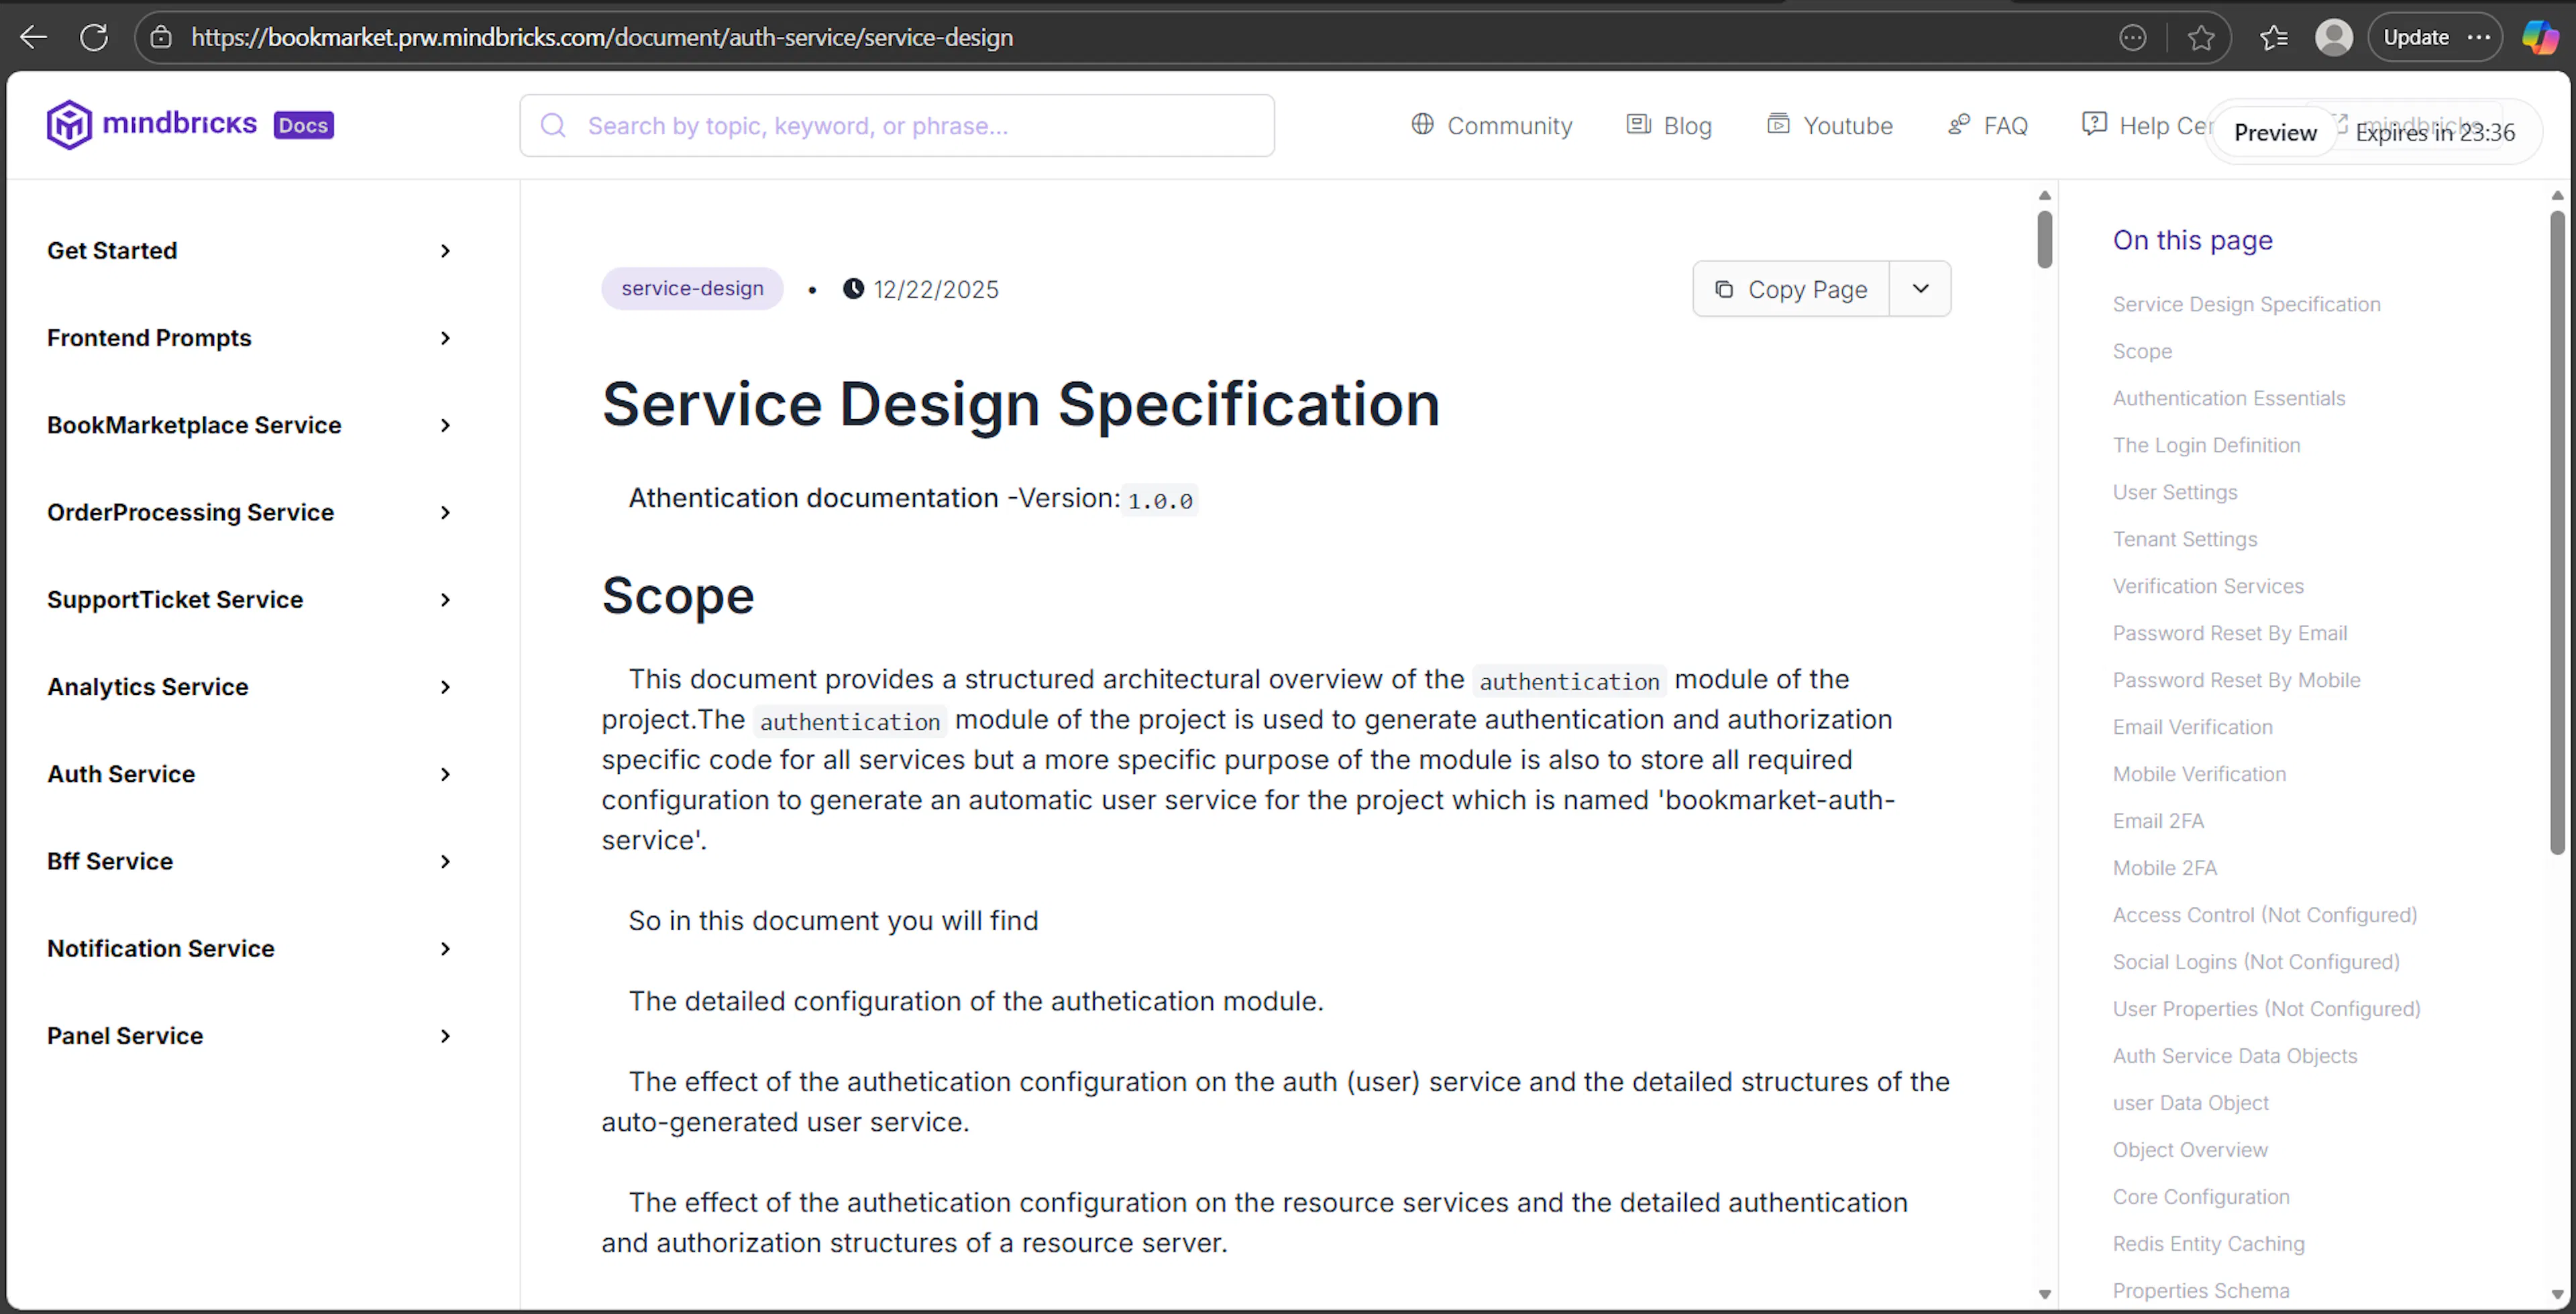
When you preview the Document Service, instead of a classic API testing interface, you are redirected to a documentation portal.
This portal acts as a central documentation hub for the entire project.
It gathers all project and services documentation in one place, including:
-
Project-level documentation
-
All microservice documents
-
Business APIs and workflows
-
REST API guides
-
Frontend prompts and integration notes
-
System design explanations generated by Mindbricks
This means you can review the complete documentation of the whole project, across all services, from a single preview link.
The documentation portal is especially useful for:
-
Sharing project docs with frontend teams
-
Reviewing system design as a whole
-
Onboarding new developers
-
Validating generated documentation before deployment
Previewing the Panel Service
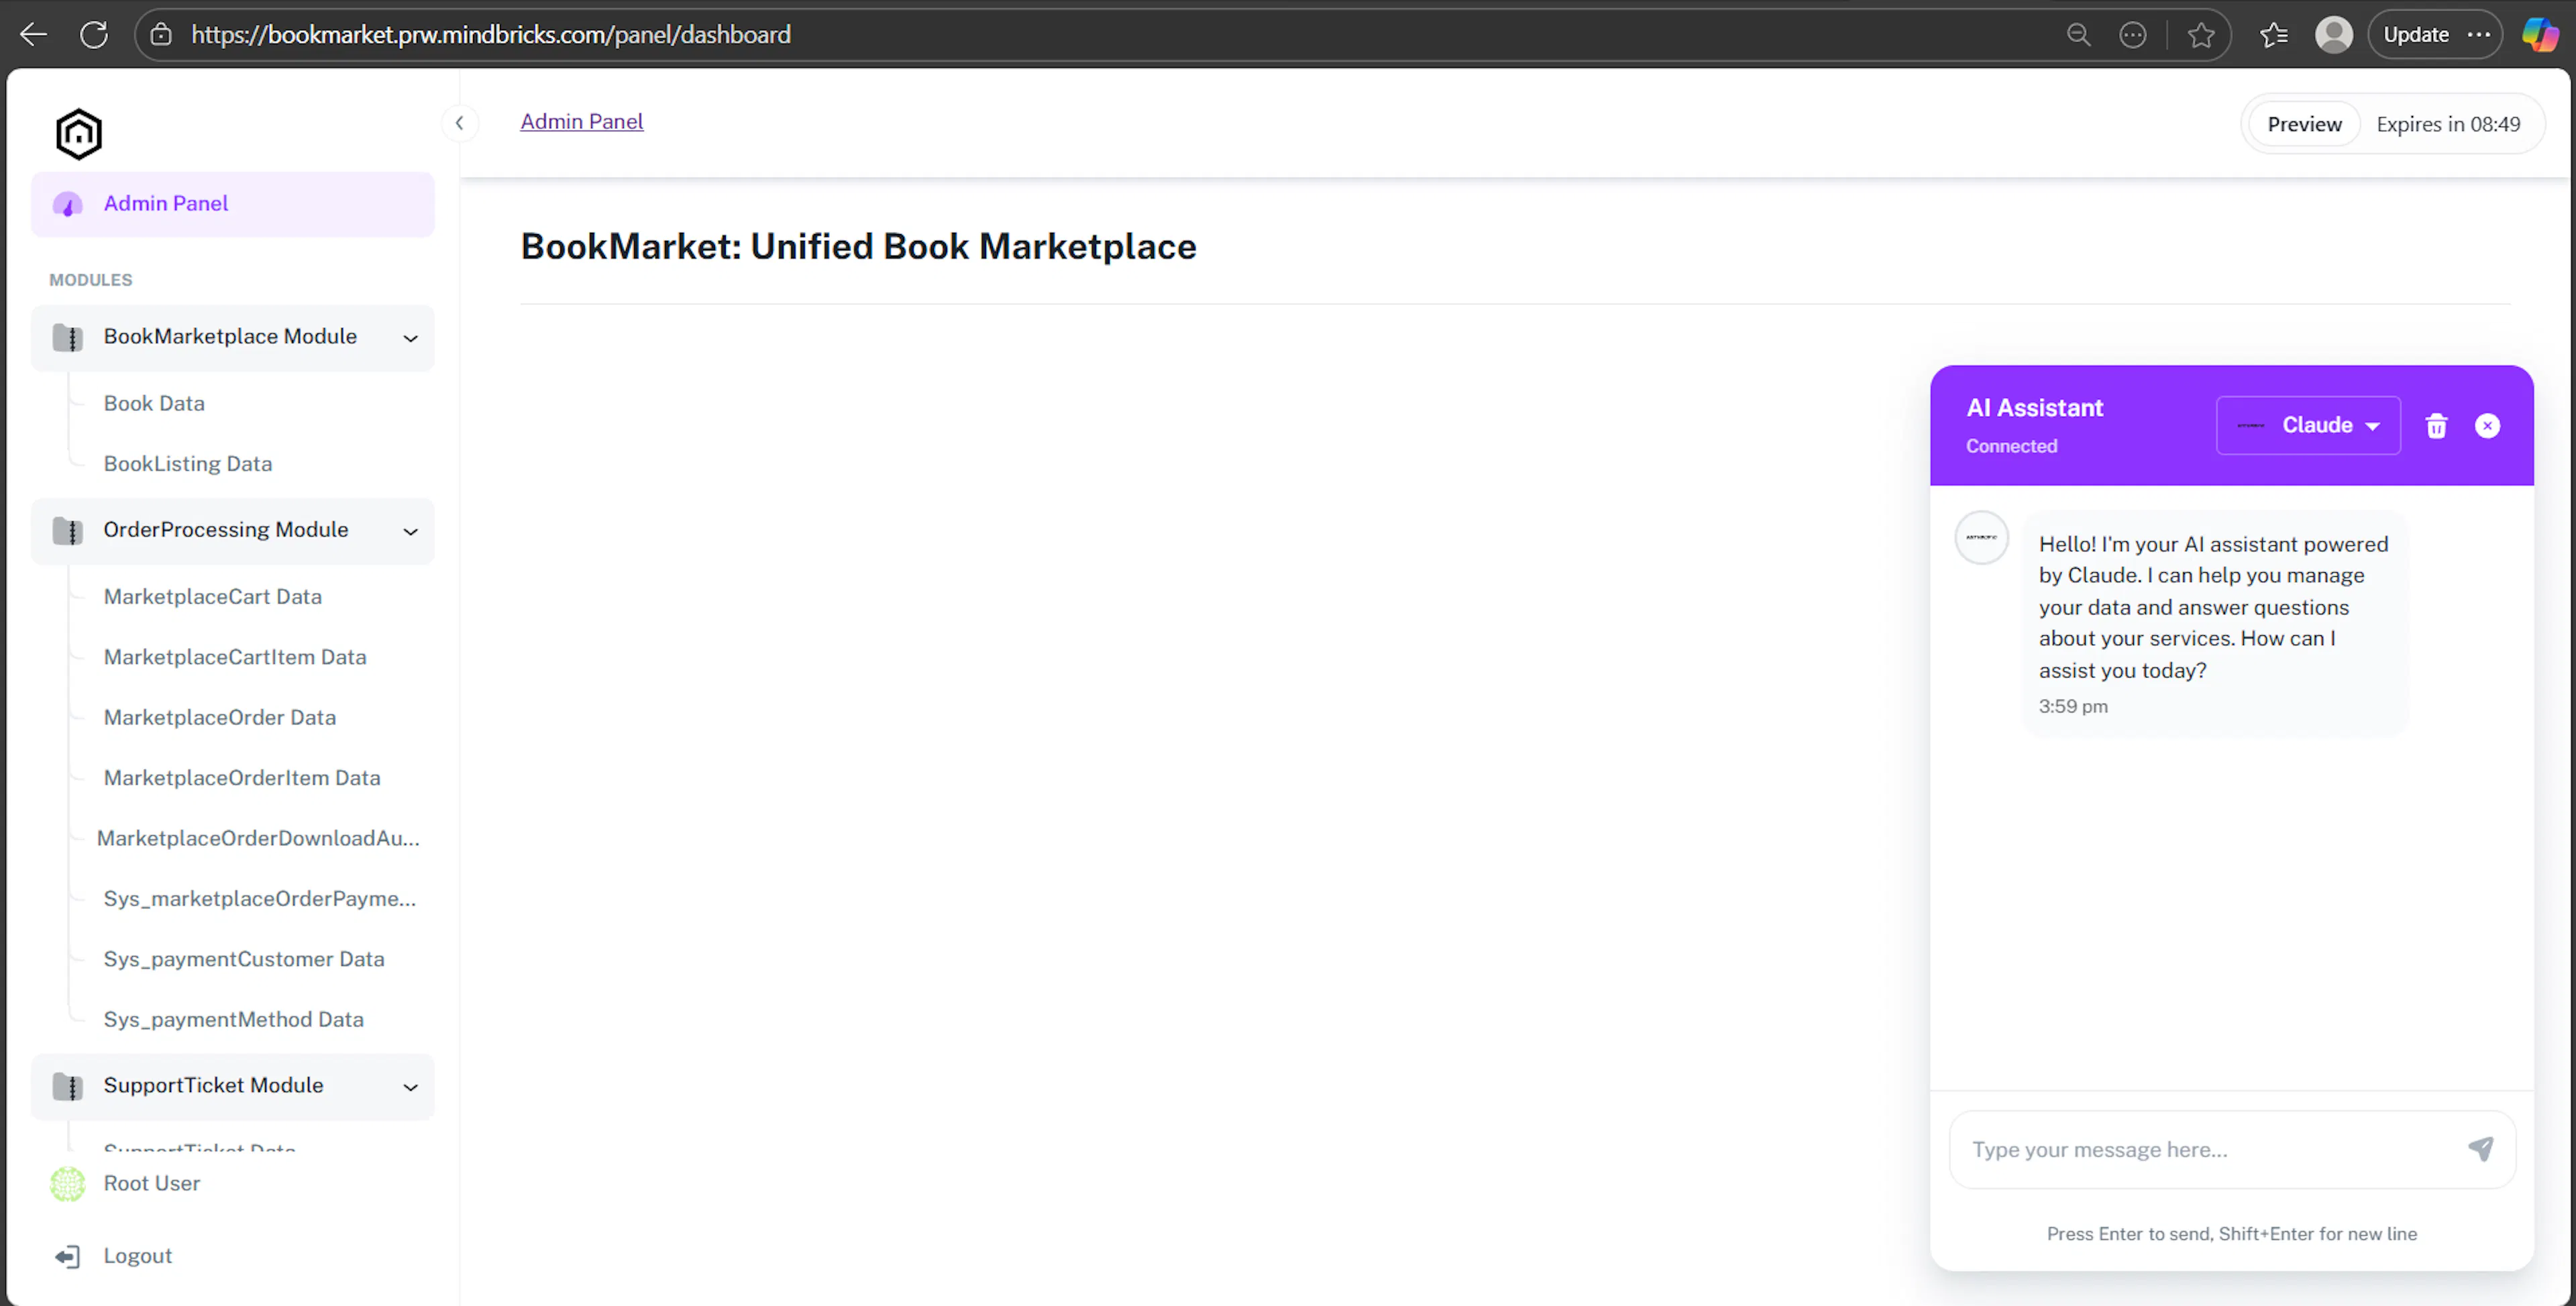
Previewing the Panel Service redirects you to an admin panel interface.
From the panel, administrators can:
-
View all services in the project
-
Access and test all APIs across services
-
Send requests just like the API interface
-
Monitor service behavior in real time
The panel also includes an AI assistant, allowing admins to:
-
Ask the AI to send API requests
-
Auto-fill request parameters
-
Explore system behavior without manual setup
The panel acts as a central operational dashboard for the entire system during preview.
Previewing the Notification Service
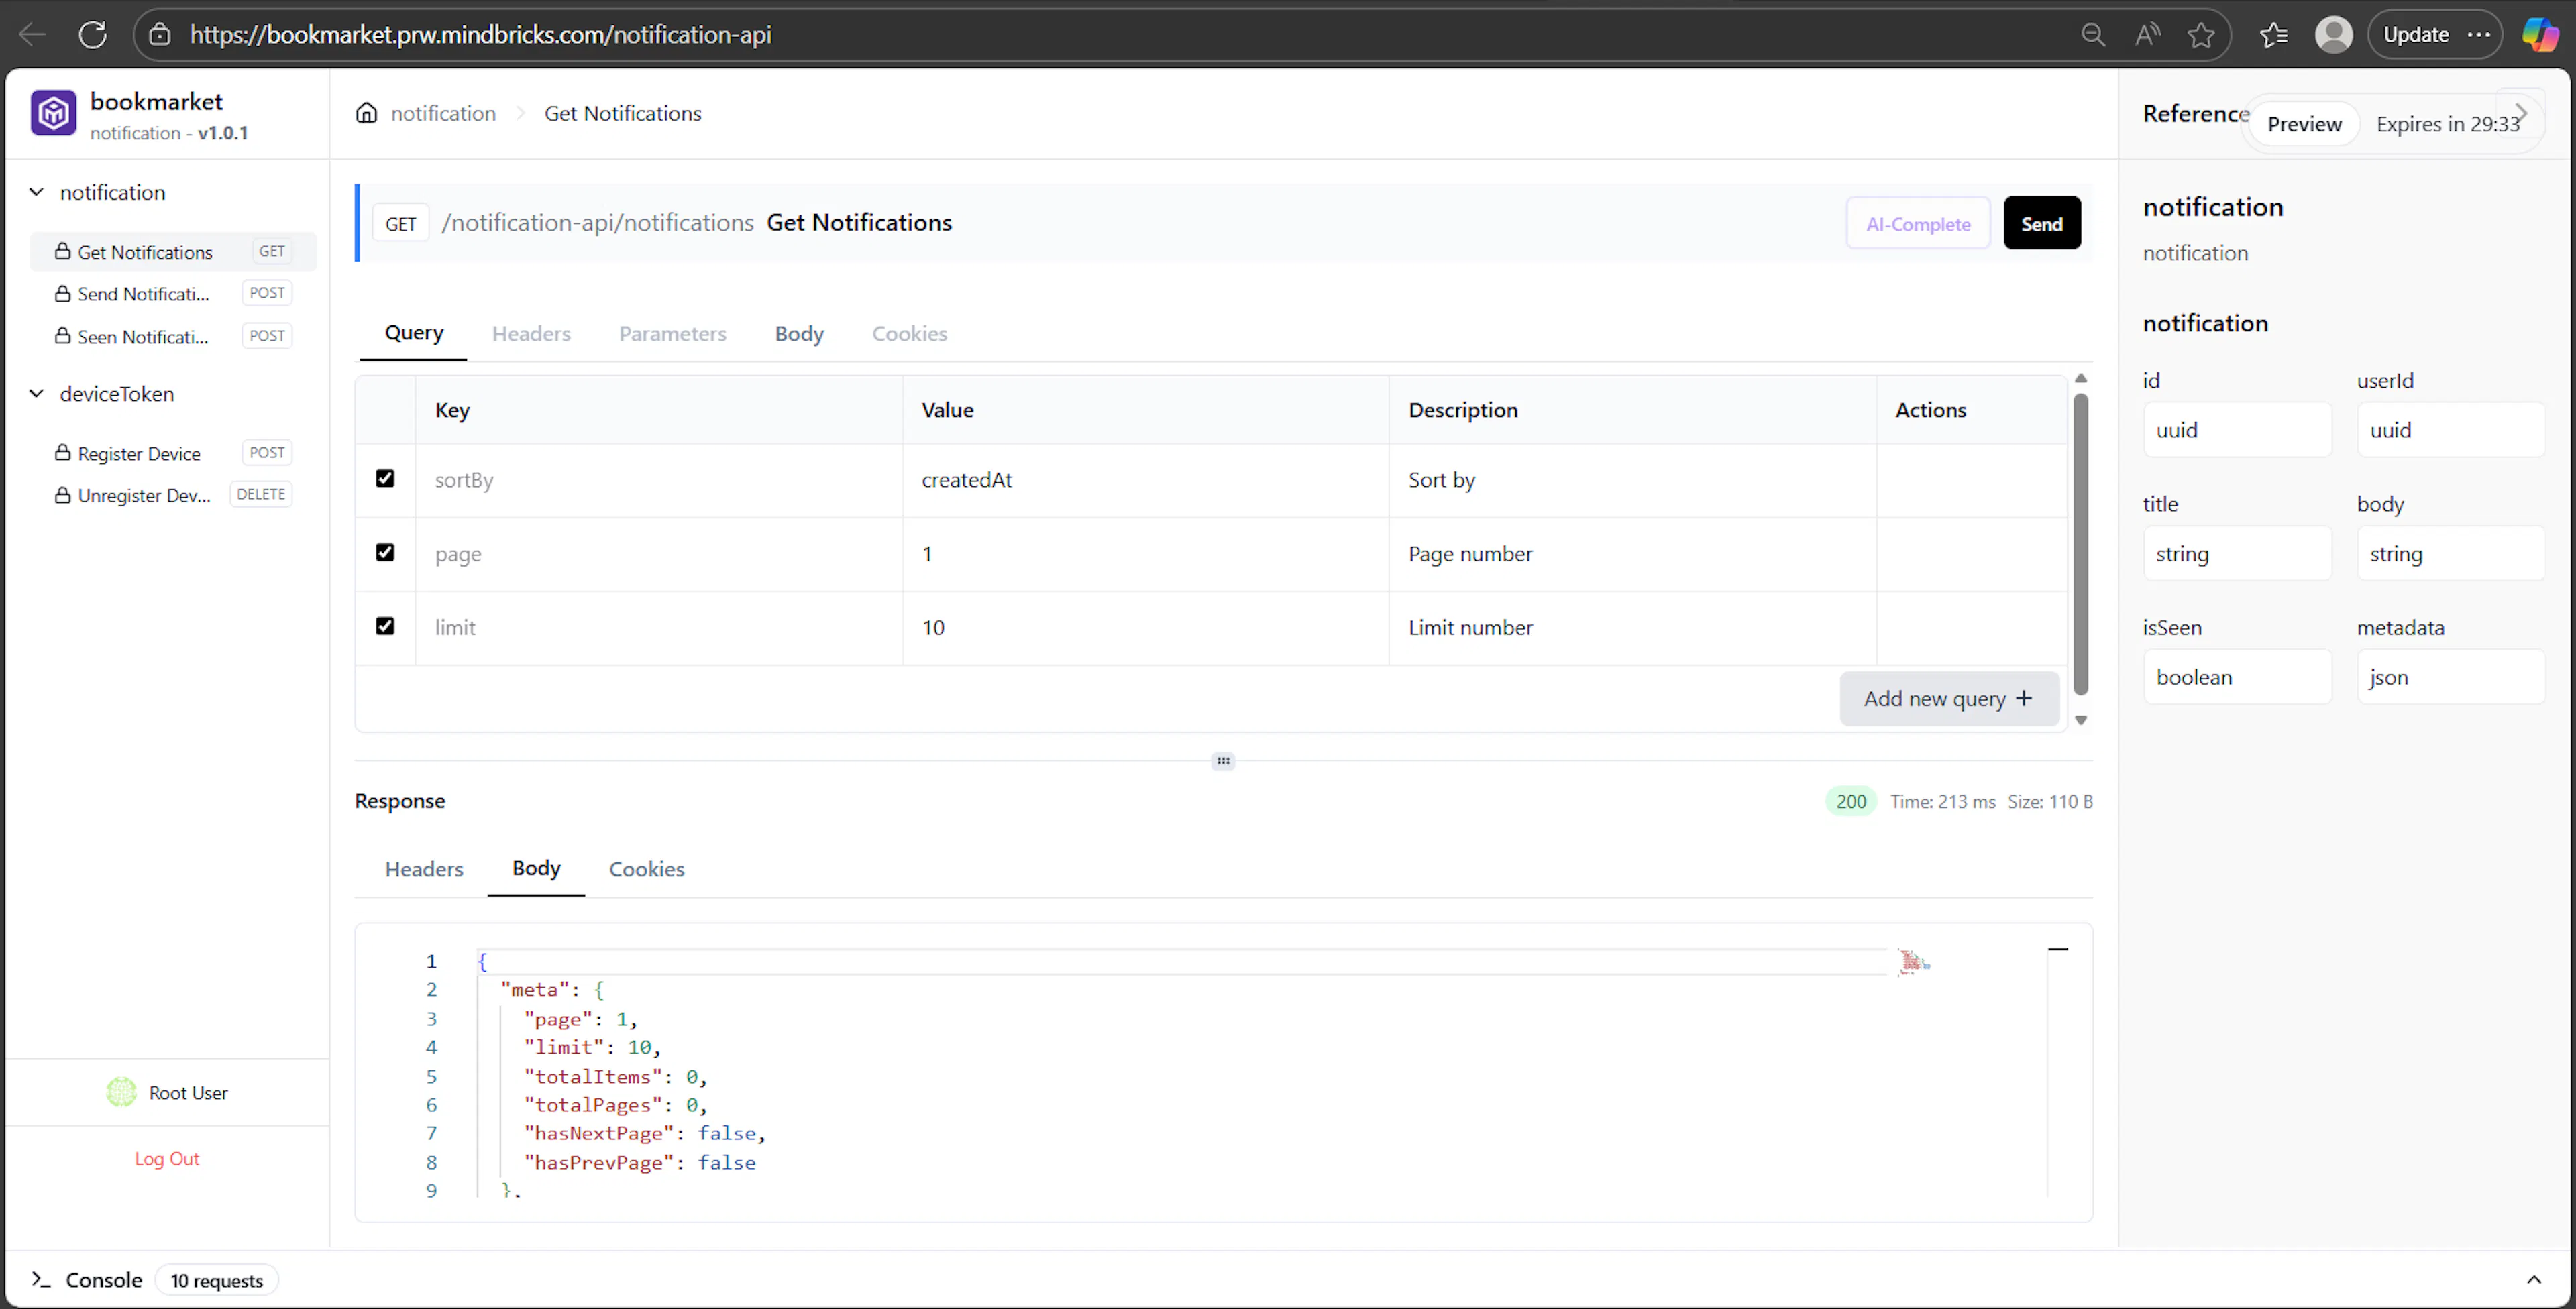
When previewing the Notification Service, the API interface focuses on:
-
Notification-related endpoints
-
Event-triggered notification APIs
-
Template-based notification logic
Previewing the BFF Service
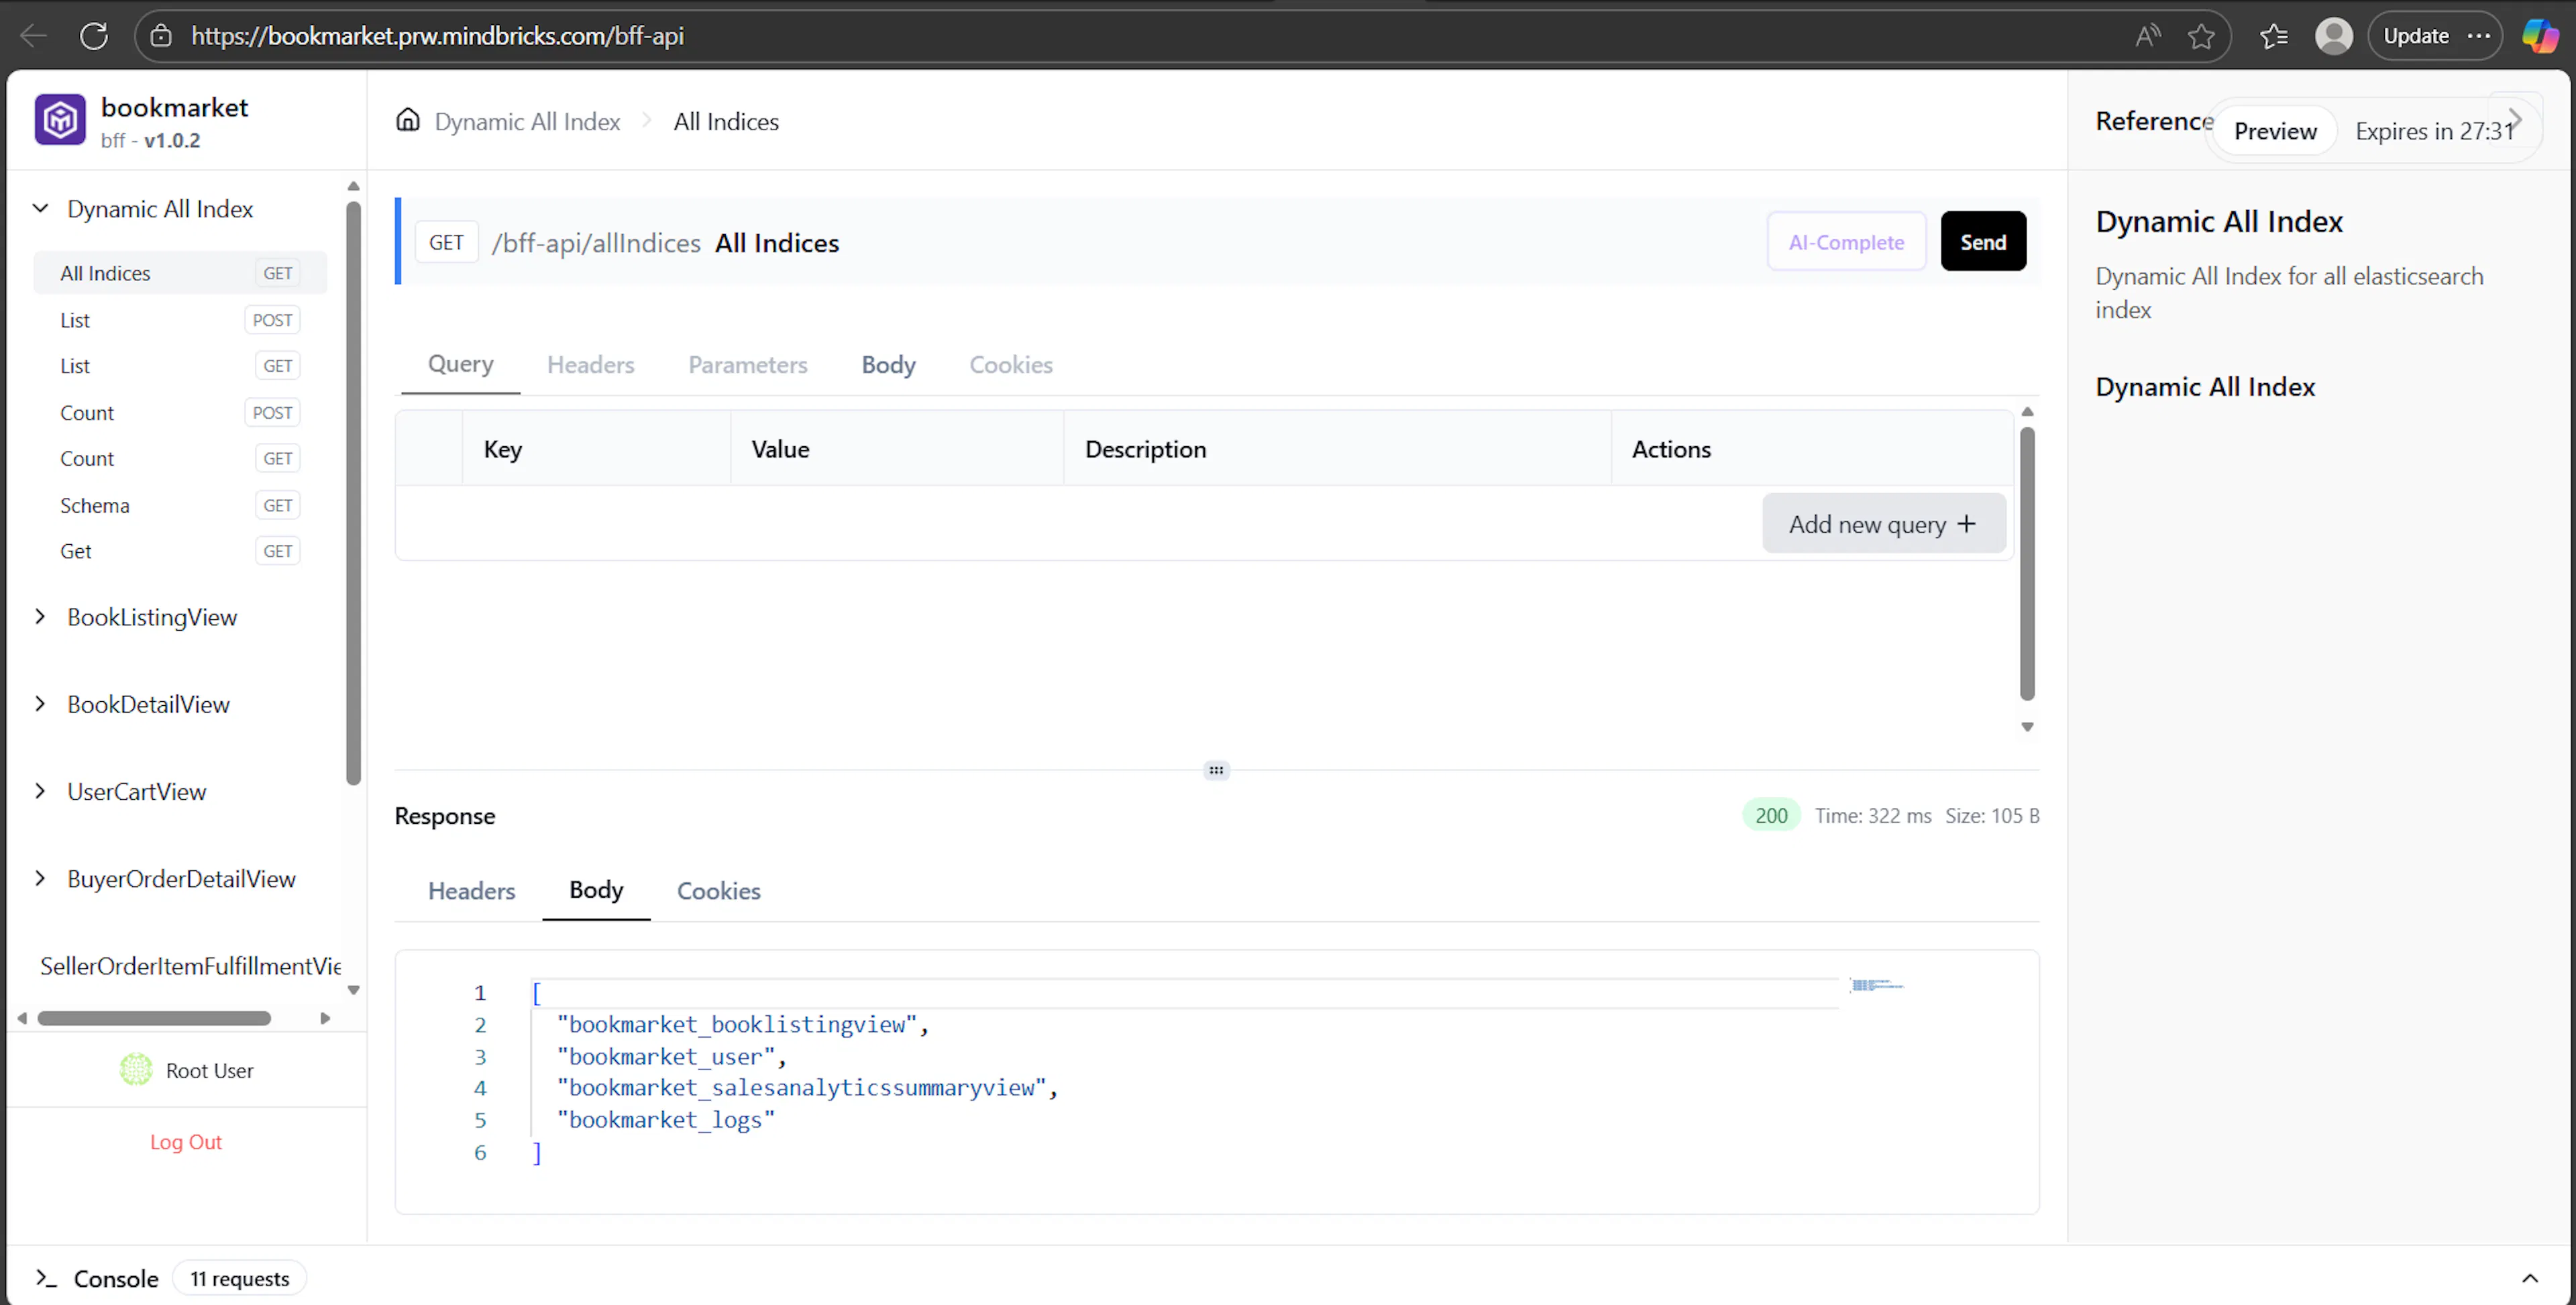
Previewing the BFF Service exposes:
-
Elasticsearch index APIs
-
Data View APIs
-
Aggregated read-model endpoints
-
Enriched response structures used by frontend applications
This allows you to test:
-
Data views
-
Aggregations
-
Stats and analytics endpoints
The BFF preview is especially useful for validating frontend-facing APIs before deployment.
These specialized previews ensure that each service is tested in the most appropriate and meaningful way, based on its responsibility in the system.
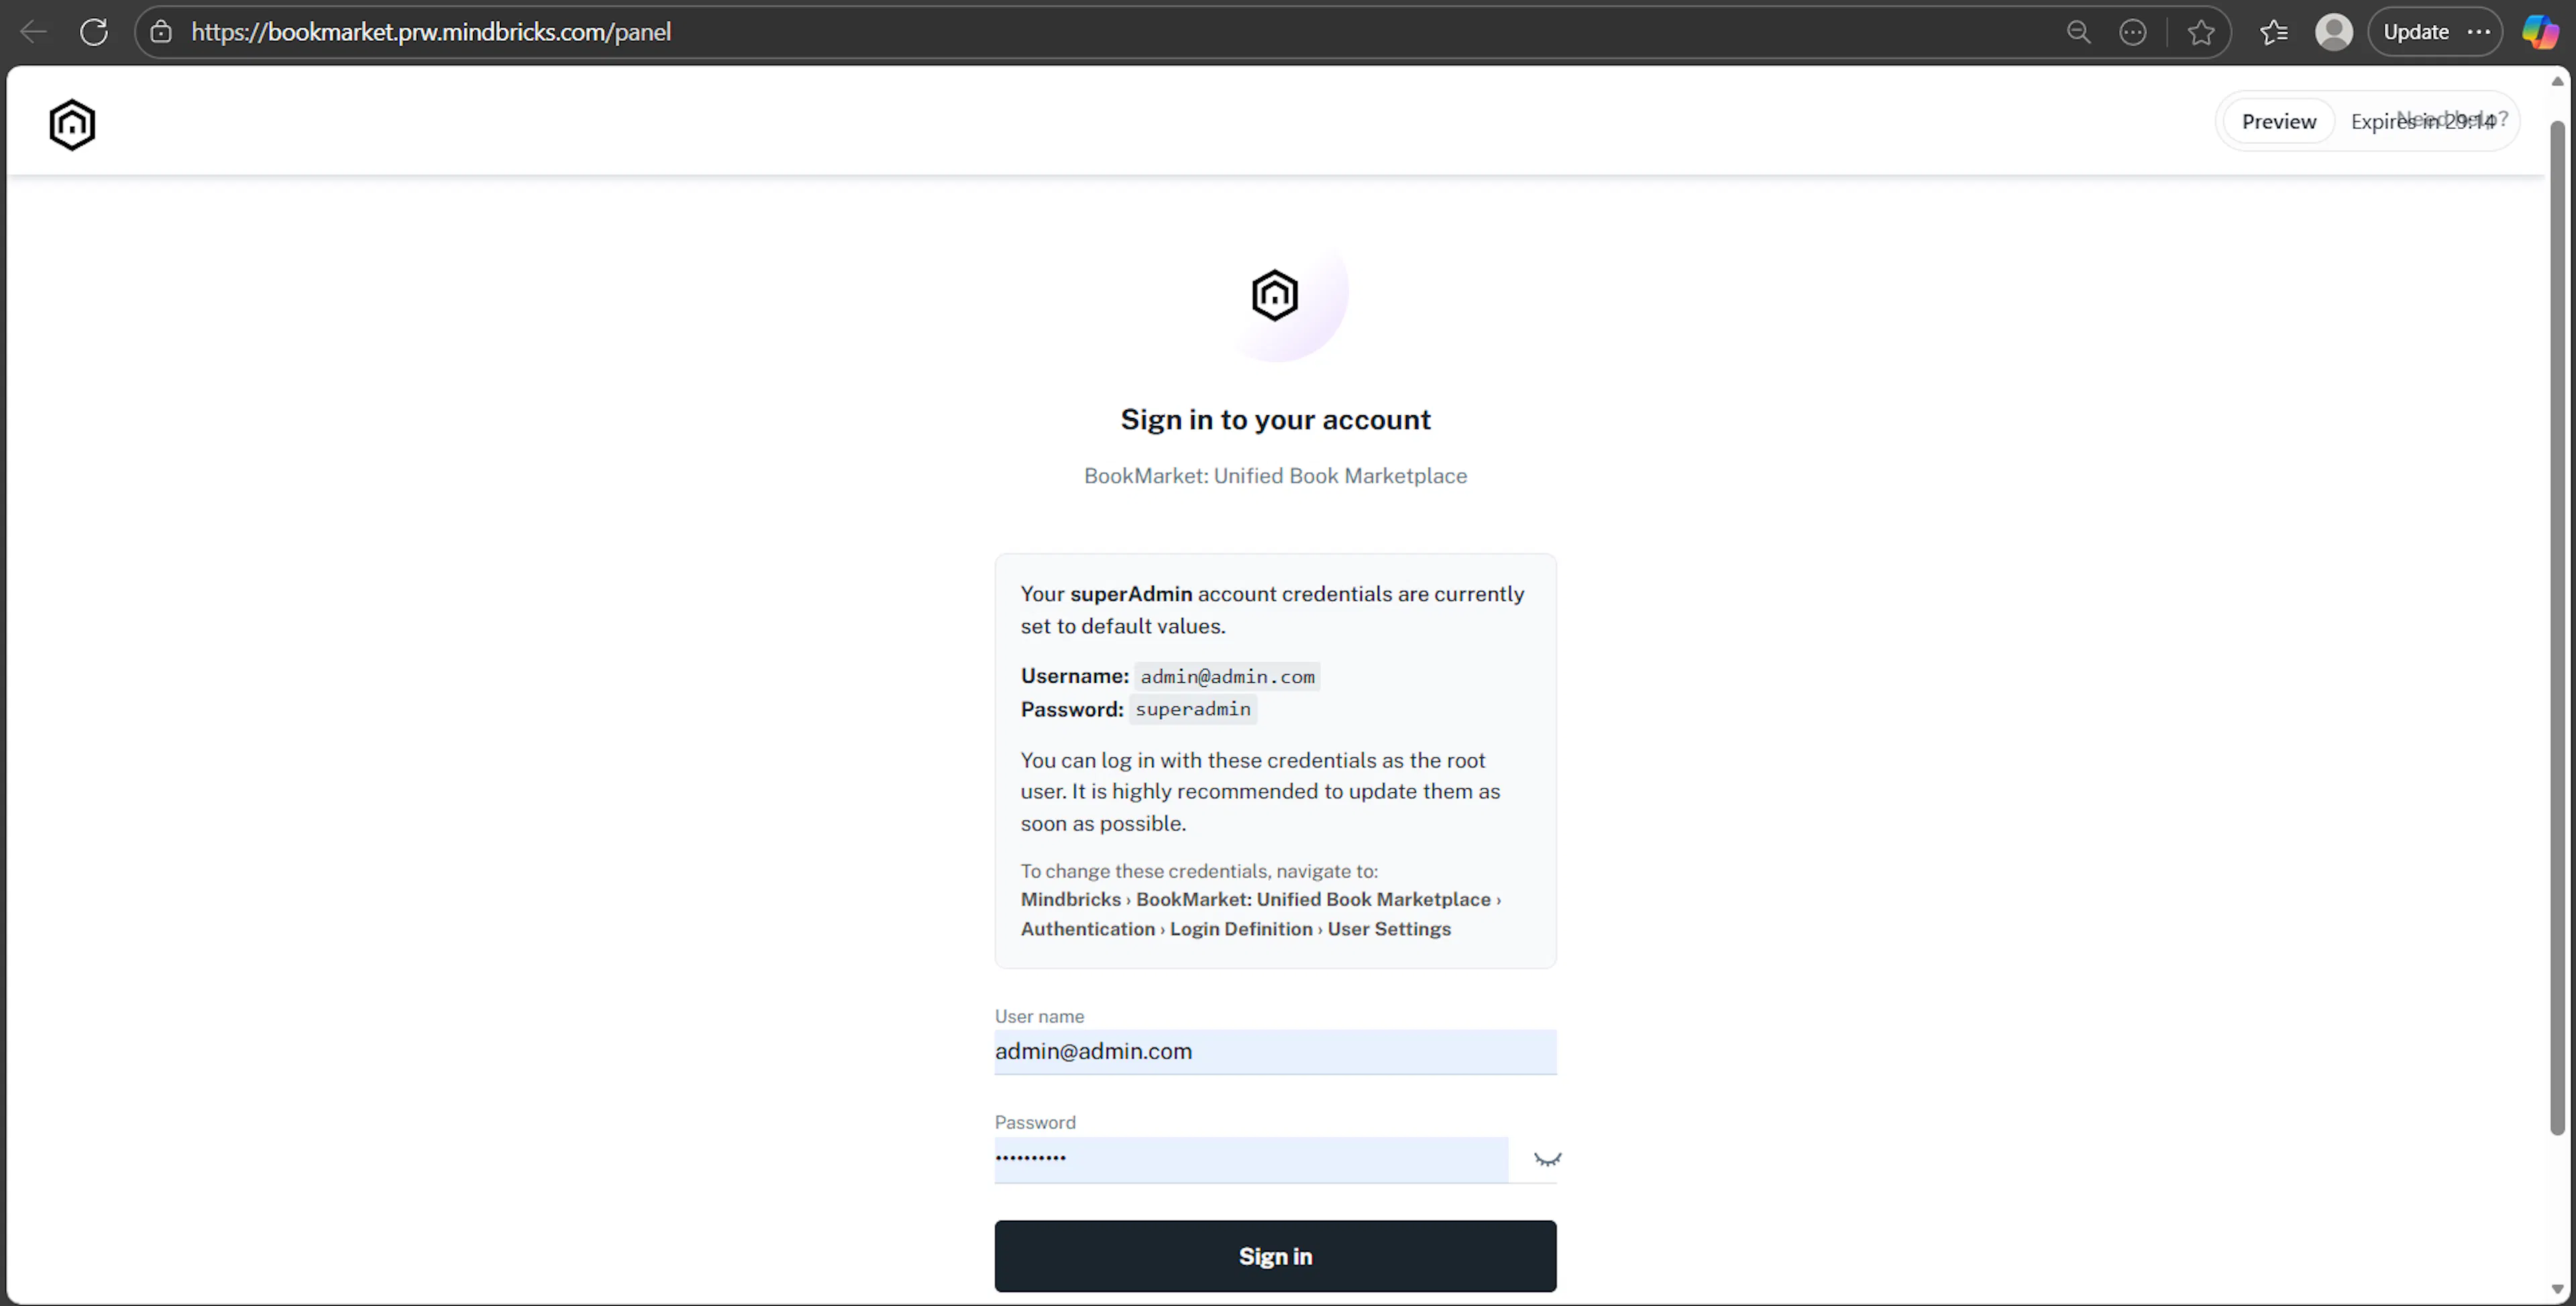
Authentication Before Testing APIs
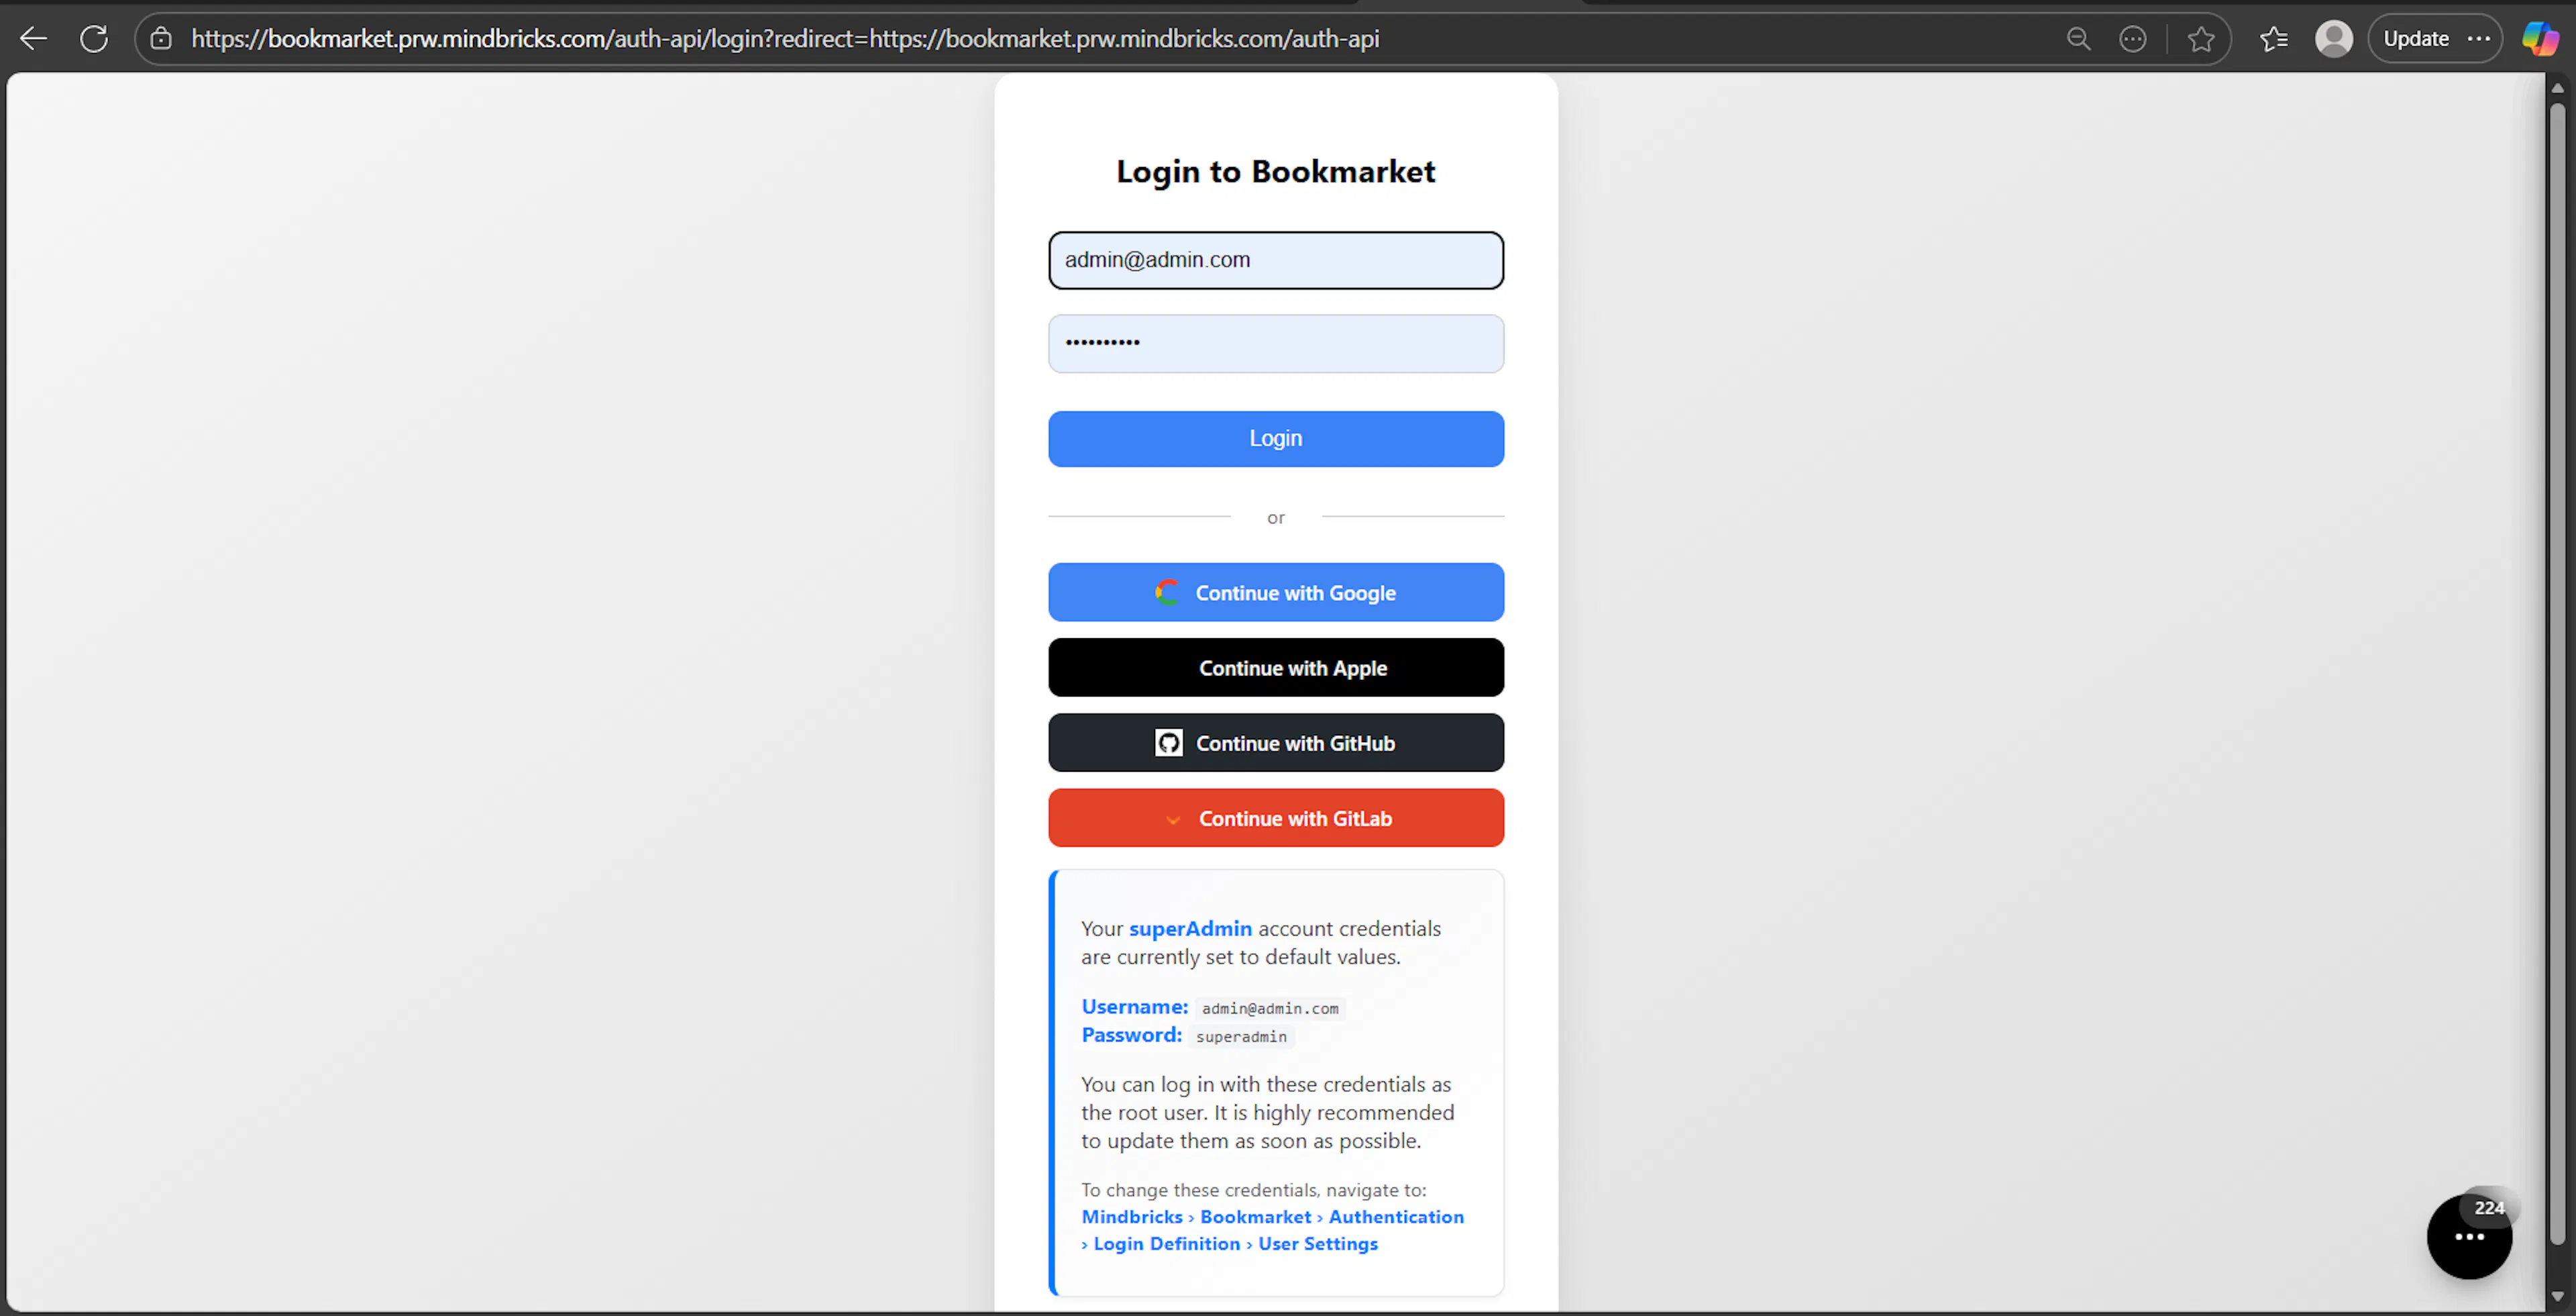
For services/endpoints that require authentication:
-
You must log in first
-
You can log in using:
-
The ready login endpoint shown in the interface
-
Or by clicking the Login action and navigating to the login screen
-
Once logged in, authentication cookies or tokens are applied automatically to subsequent requests.
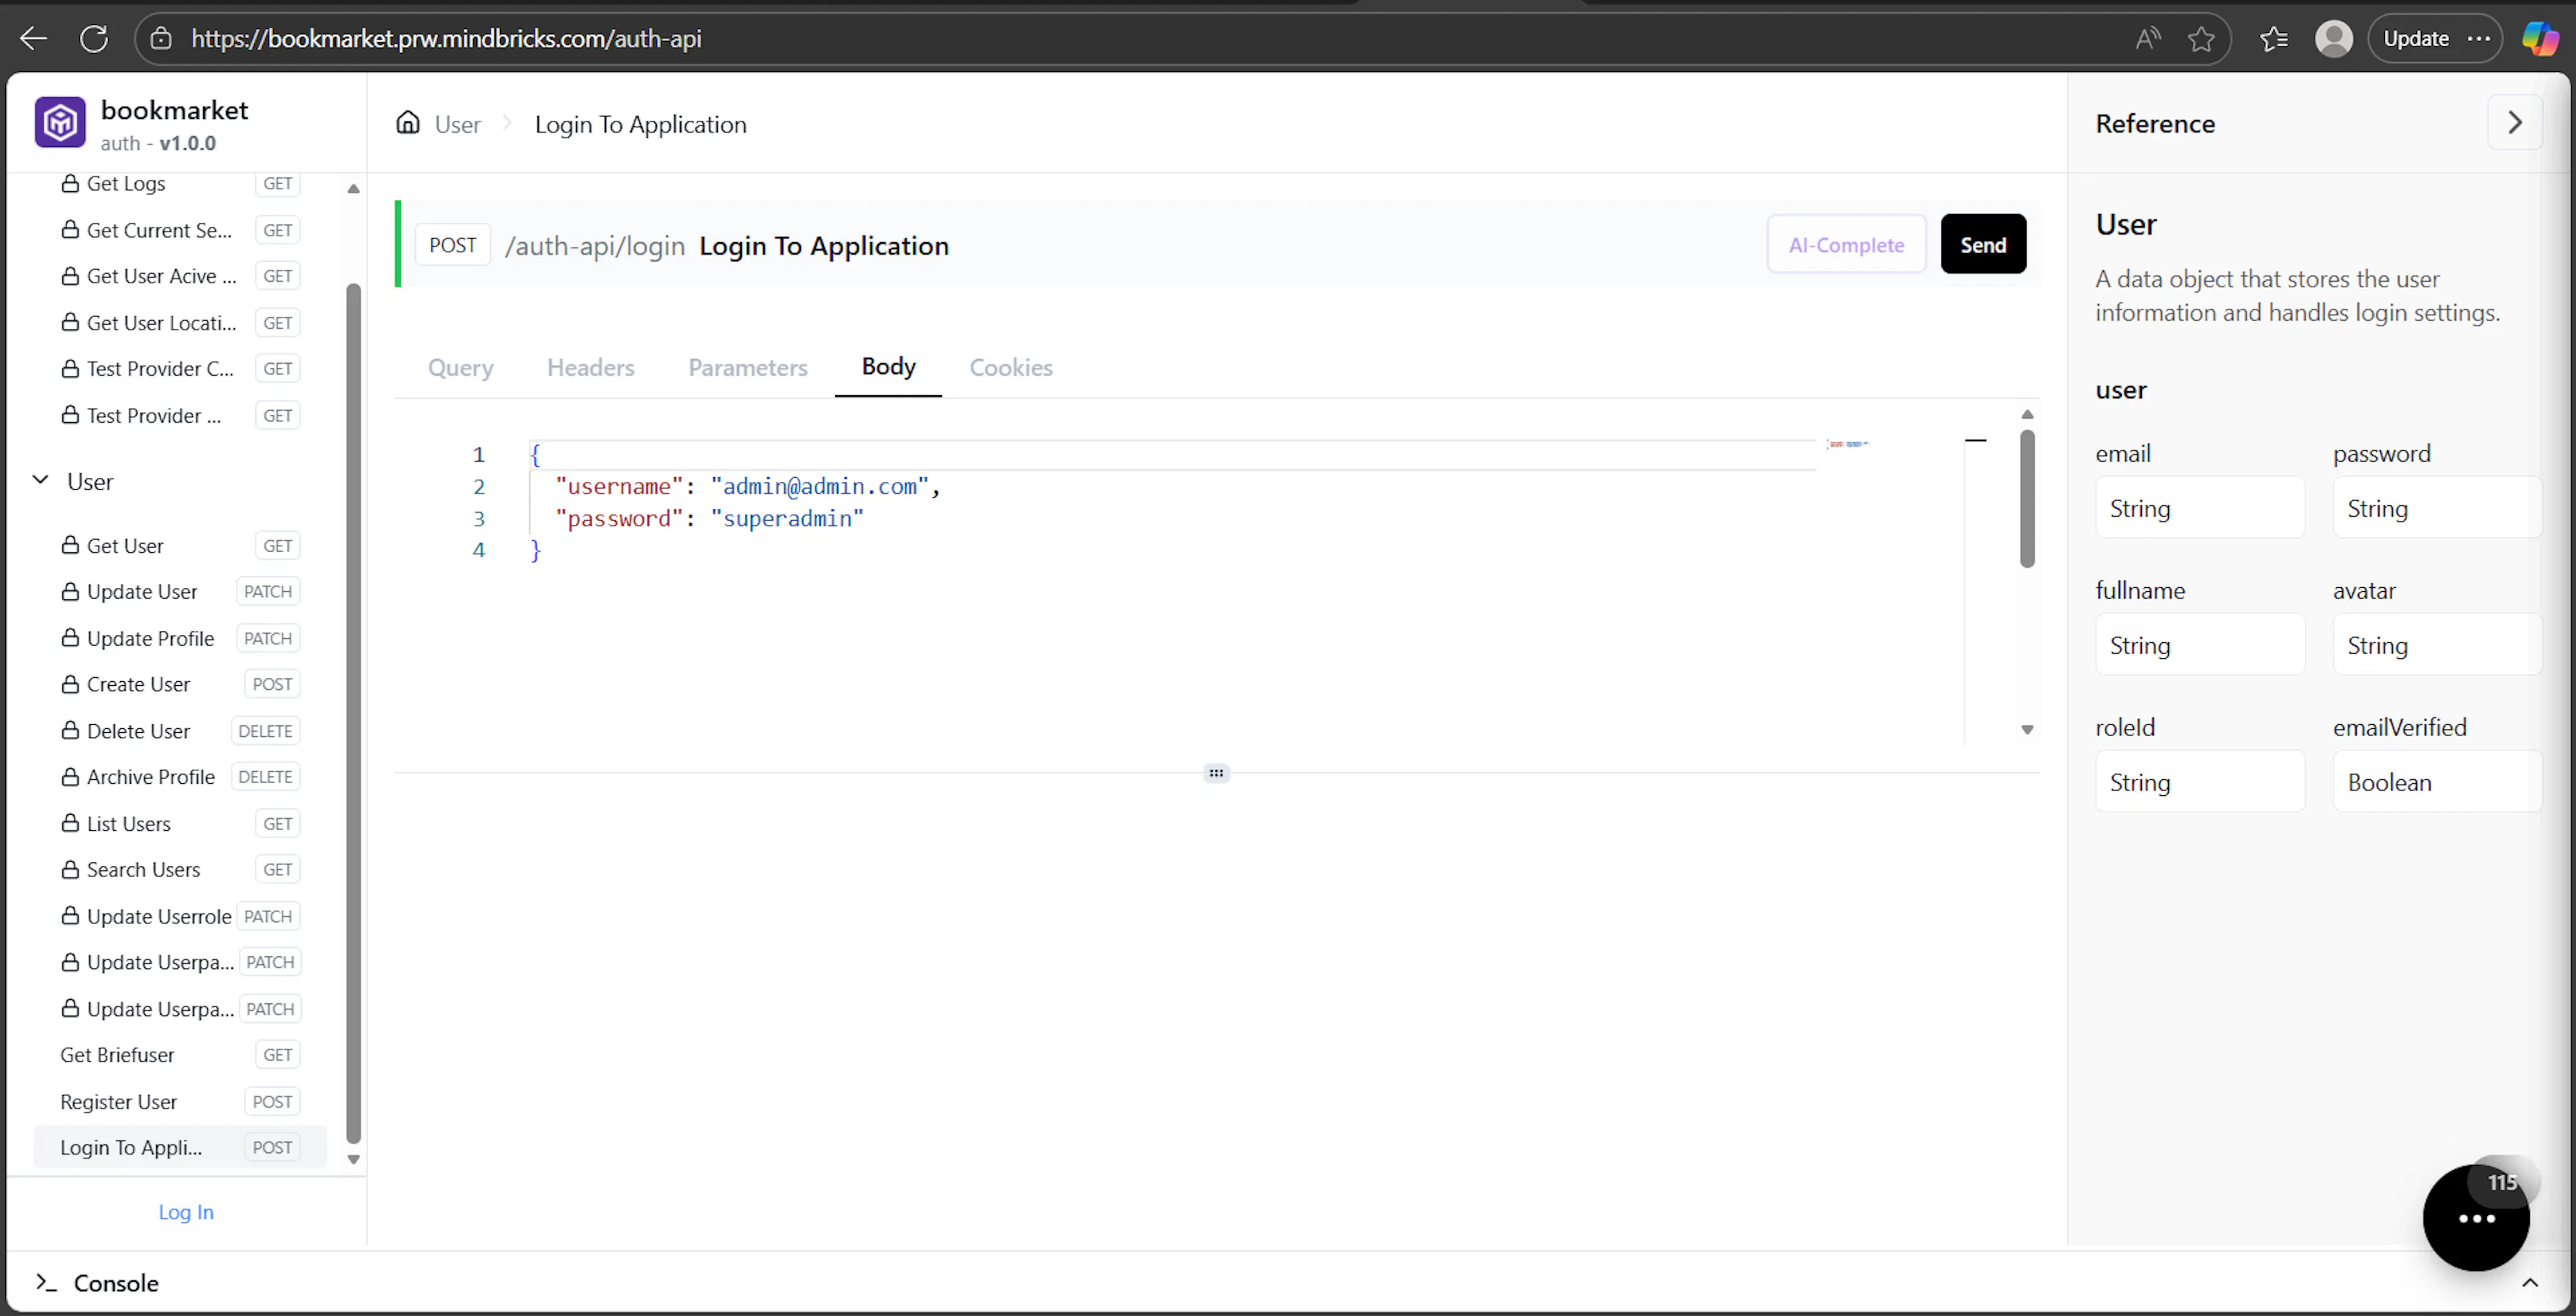
Sending API Requests
Inside the API interface:
-
Select an endpoint from the left sidebar
-
Fill in required fields:
-
Query parameters
-
Headers
-
Path parameters
-
Body (JSON)
-
Cookies
-
-
Default query fields are pre-generated when applicable
-
Click Send to execute the request
Responses appear immediately below in the Response panel, including:
-
Status code
-
Execution time
-
Response body
-
Headers and cookies (if any)
Admin vs User APIs
Some endpoints are admin-only.
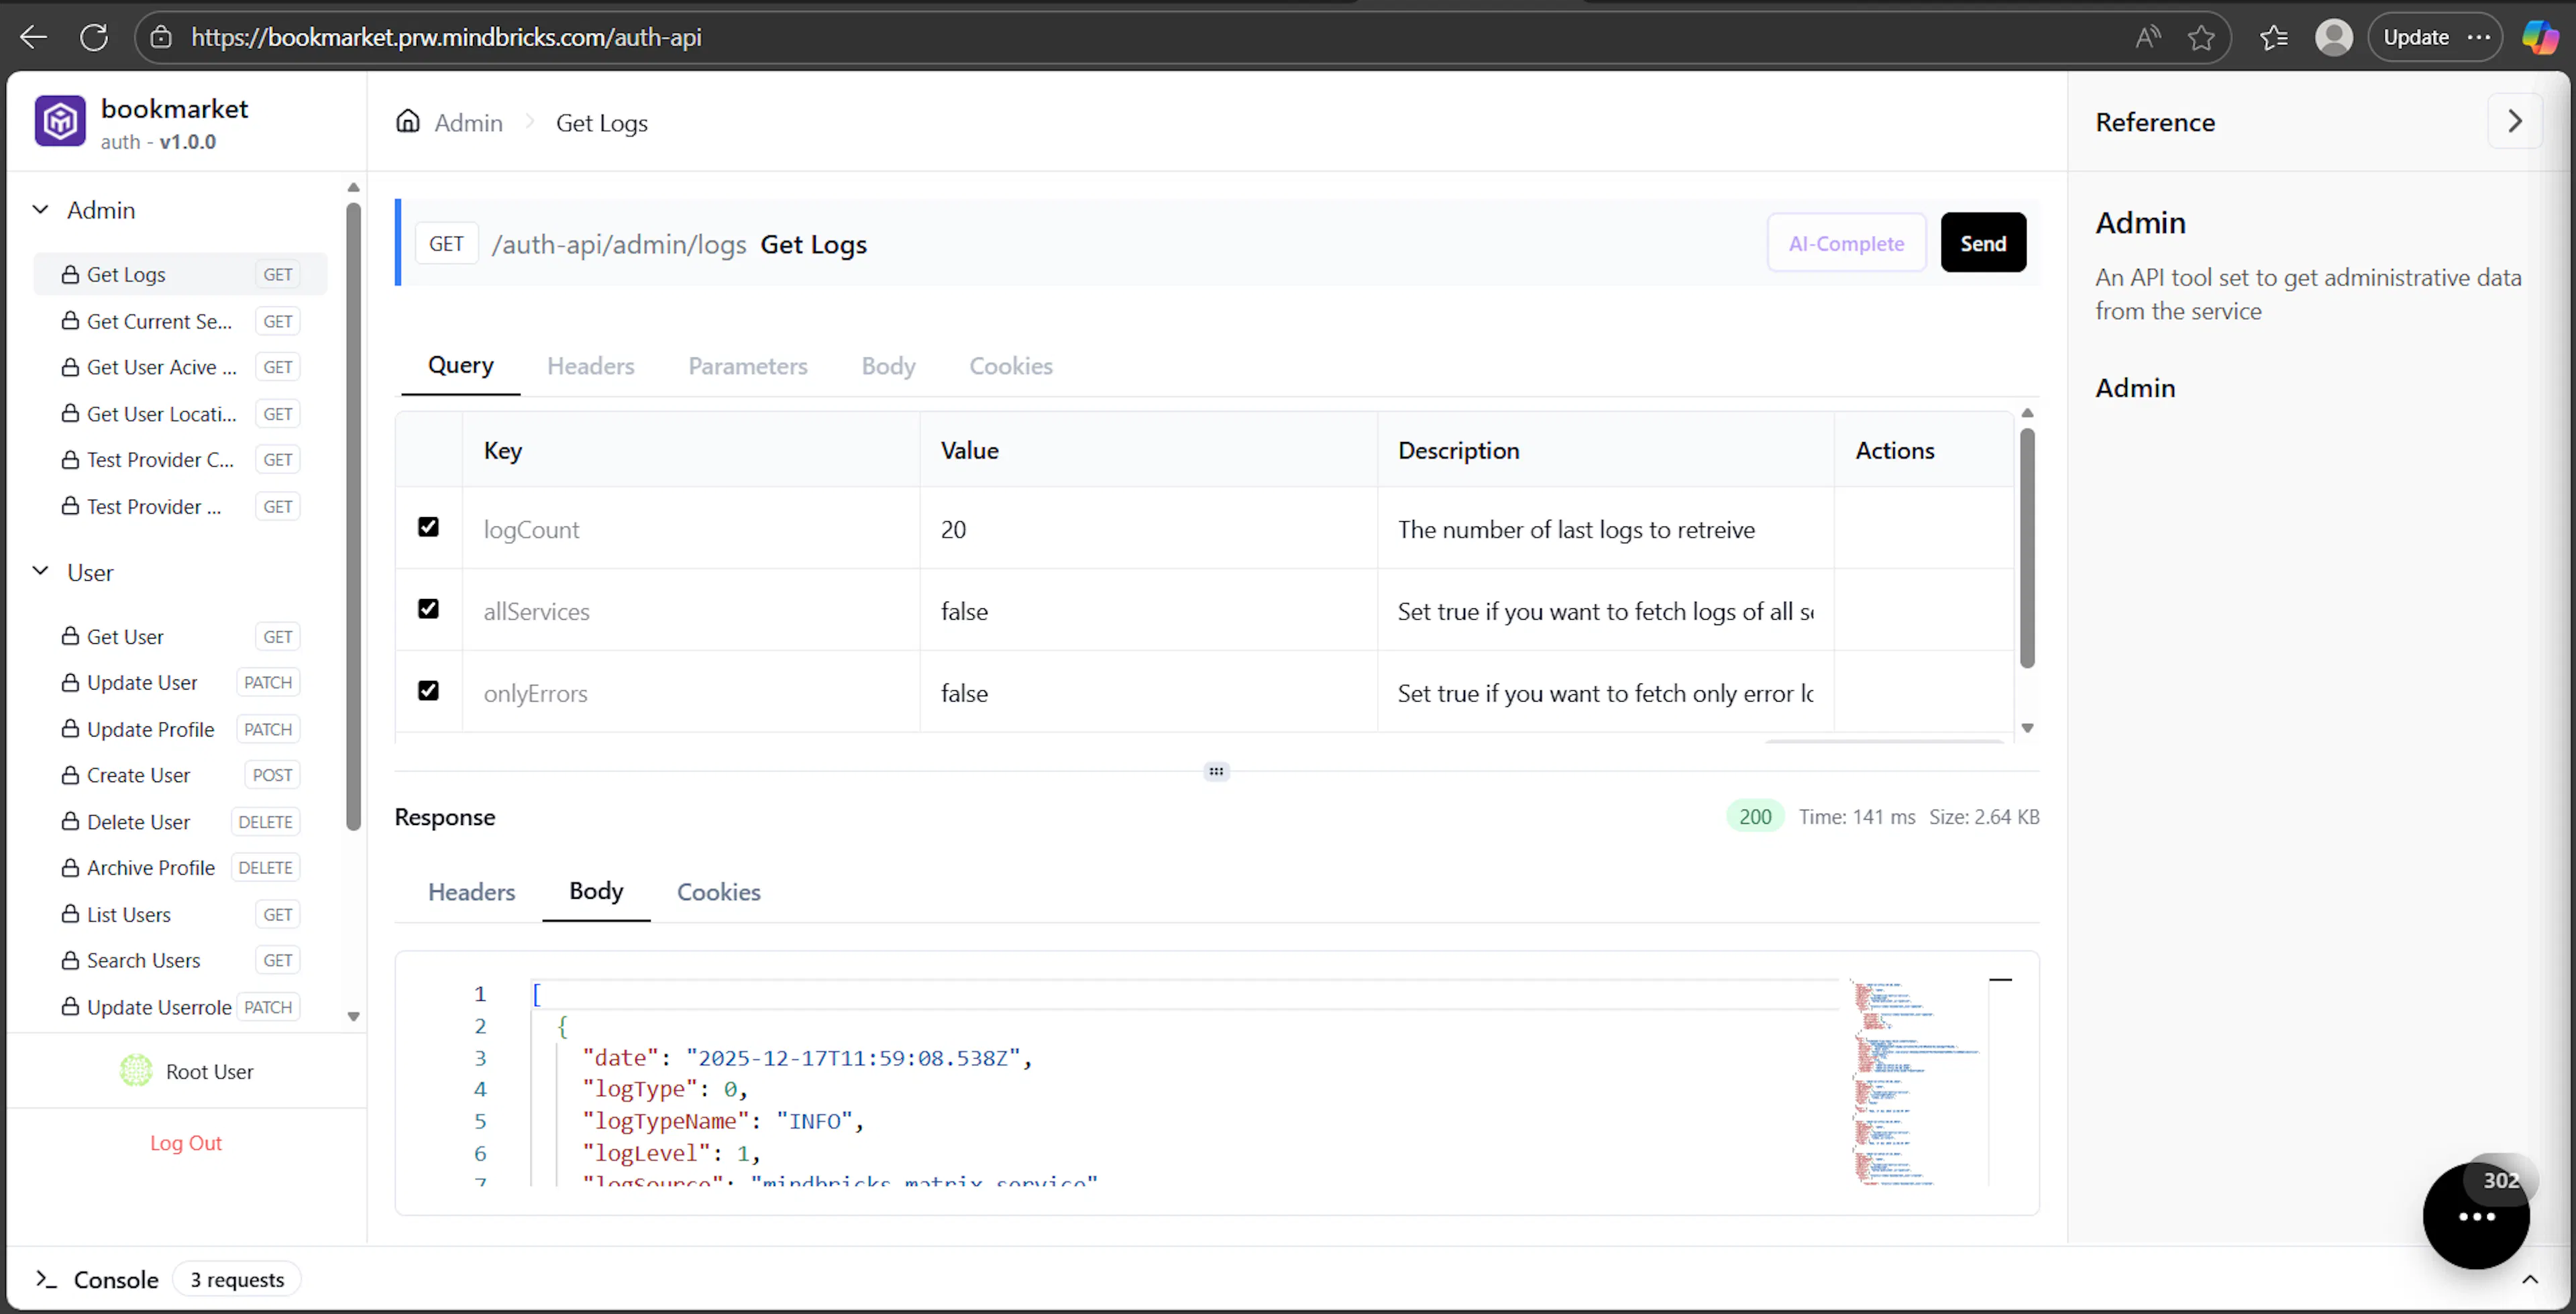
For example:
-
Admin log retrieval
-
System-level diagnostics
-
Administrative user operations
These endpoints are visible only when logged in as an admin , super admin or other high level role account.
Other endpoints represent standard data object APIs, such as:
-
User
-
Order
-
Product
-
Ticket
Data Objects & Generated APIs
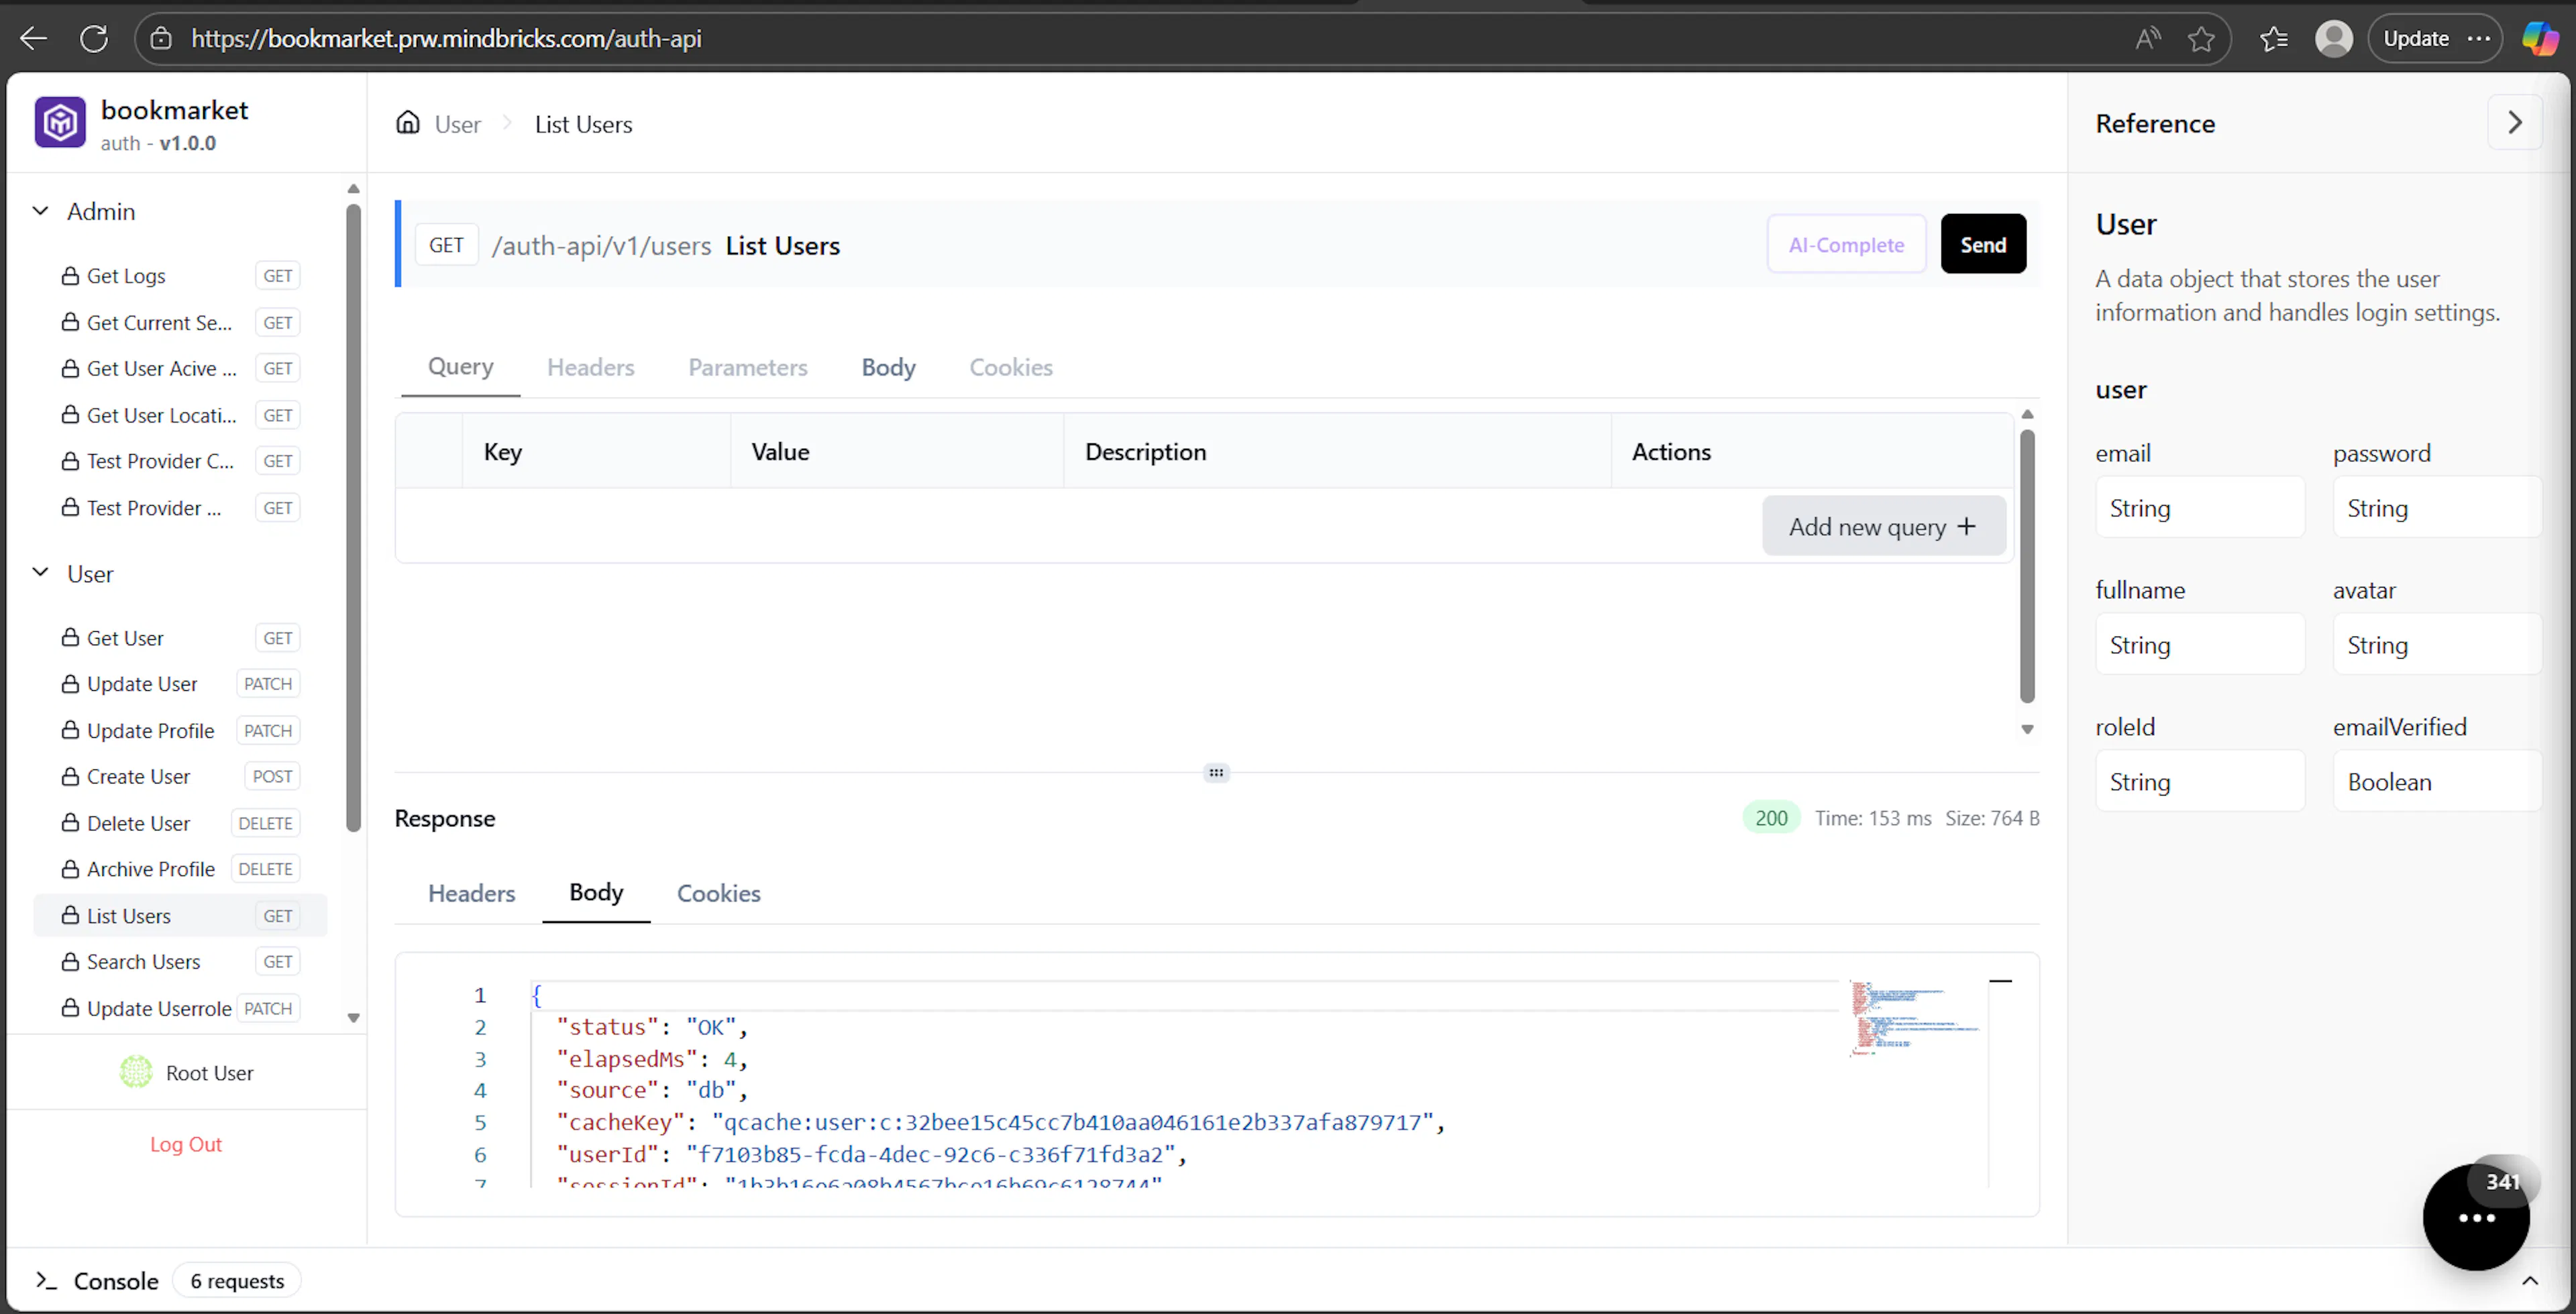
For each data object:
-
All CRUD and list APIs are generated automatically
-
Endpoints are grouped under the data object name
-
On the right side, you can see:
-
Property names
-
Property types
-
Required/optional indicators
-
This makes it easy to understand the structure of the data and test real scenarios quickly.
Request Console & History
By opening the Console panel:
-
You can see all executed requests
-
Each request shows:
-
HTTP method
-
Endpoint path
-
Execution time
-
Status code
-
-
A request counter shows how many requests were made during the session
This is useful for debugging flows and verifying behavior step by step.
Preview Tools (Floating Actions Menu)
Inside the preview interface, a floating tools menu provides advanced testing and inspection options.
Email Log (Test Mode)

-
Displays emails that would be sent by the service
-
Used for testing verification emails, notifications, and alerts
-
Emails are not actually sent in test mode. Instead, they appear here for inspection
Unit Test Runner
-
Allows you to run generated unit tests
-
Shows:
-
Test duration
-
Success rate
-
Total test count
-
-
You can inspect each test case and its result
This helps validate service logic and integrity before deployment.
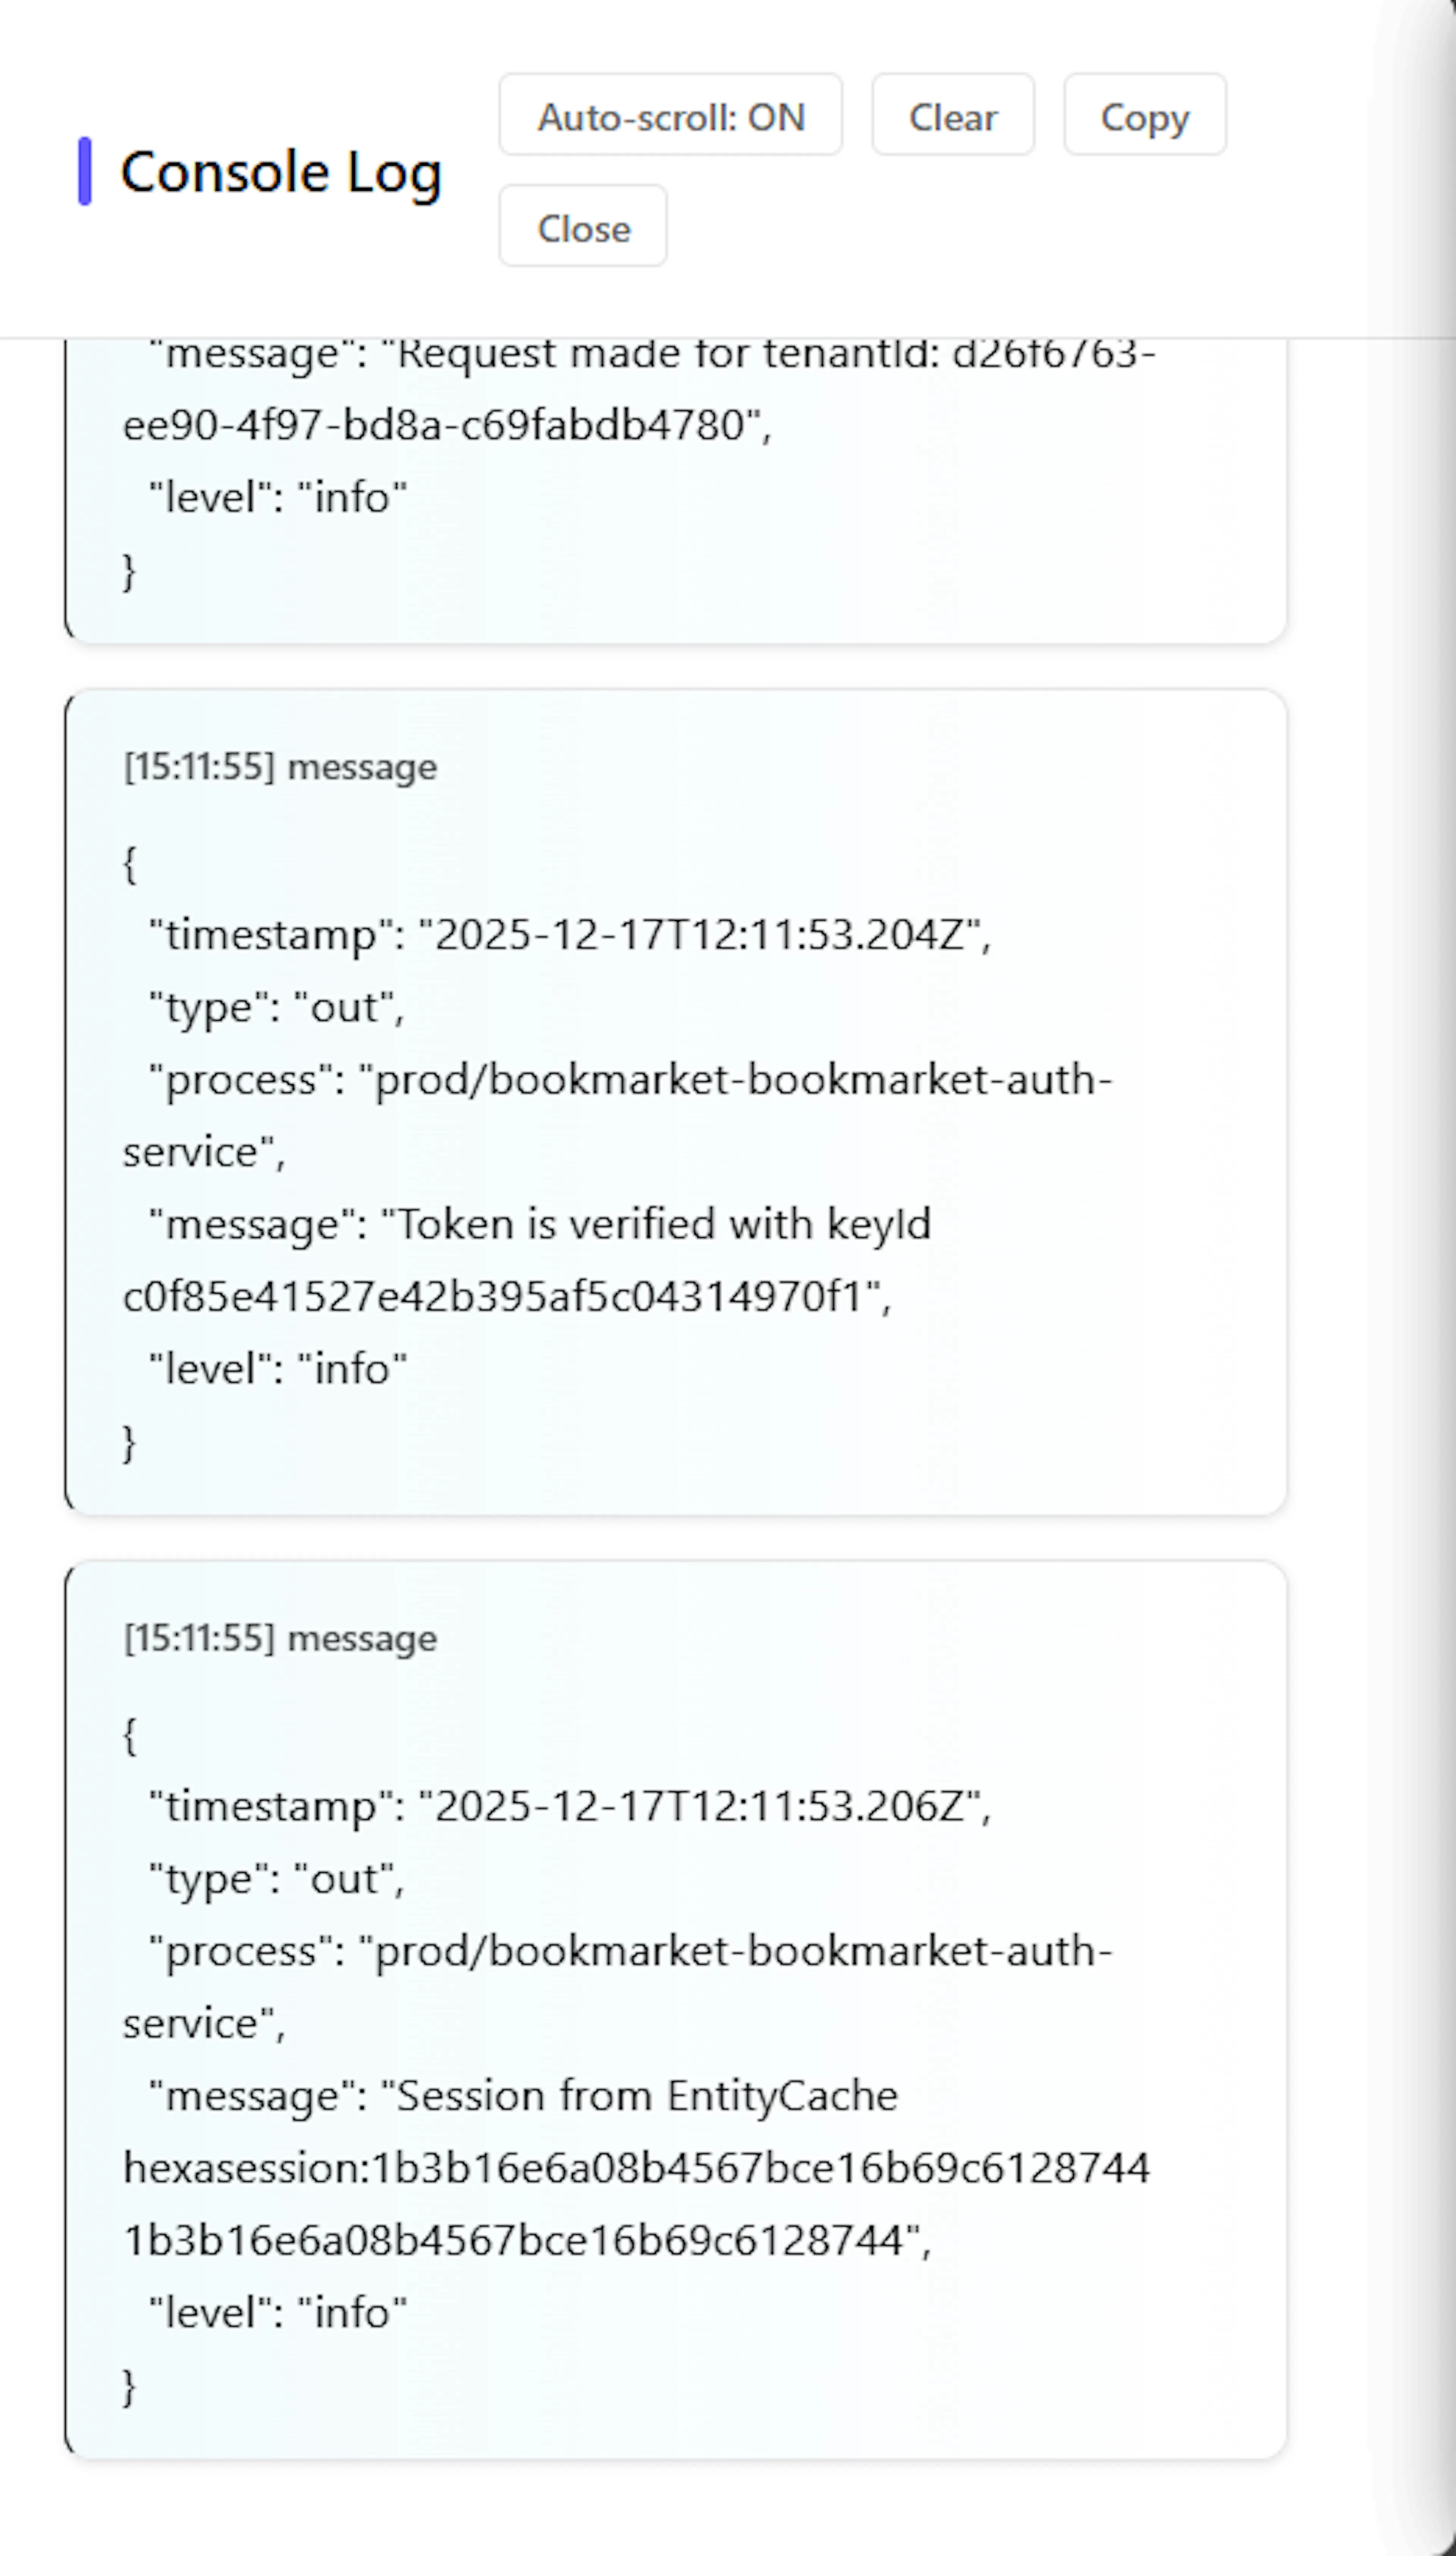
Service Logs
-
Shows logs generated by the service during preview
-
Includes:
-
Incoming requests
-
Internal actions
-
Errors and warnings
-
-
Useful for debugging unexpected behavior
AI Assistant (Preview Mode)
-
An AI assistant is available inside the preview
-
You can ask it to:
-
Send example API requests
-
Fill request bodies automatically
-
Explain endpoint behavior
-
Help debug responses
-
The assistant operates within the context of the selected service.
Internal Service Console
-
Displays internal
console.logoutput -
Helps track:
-
Custom debug messages
-
Internal state changes
-
Execution flow
-
This is especially useful when testing complex business logic.
What Preview Is (and Is Not)
Preview is:
-
Safe
-
Temporary
-
Isolated
-
Ideal for testing and validation
Preview is not:
-
Production
-
Persistent
-
Externally accessible after expiration
For real users and live traffic, use Deployments to staging or production environments.
This preview flow ensures that every service works as expected before deployment, giving you confidence, visibility, and full control over your system.